Capacity Planning Software: Future Load Graph
Predict Resource Demand and Output, Analyze Resource Load & Bottlenecks with AI-Driven Resource Capacity Planning Software
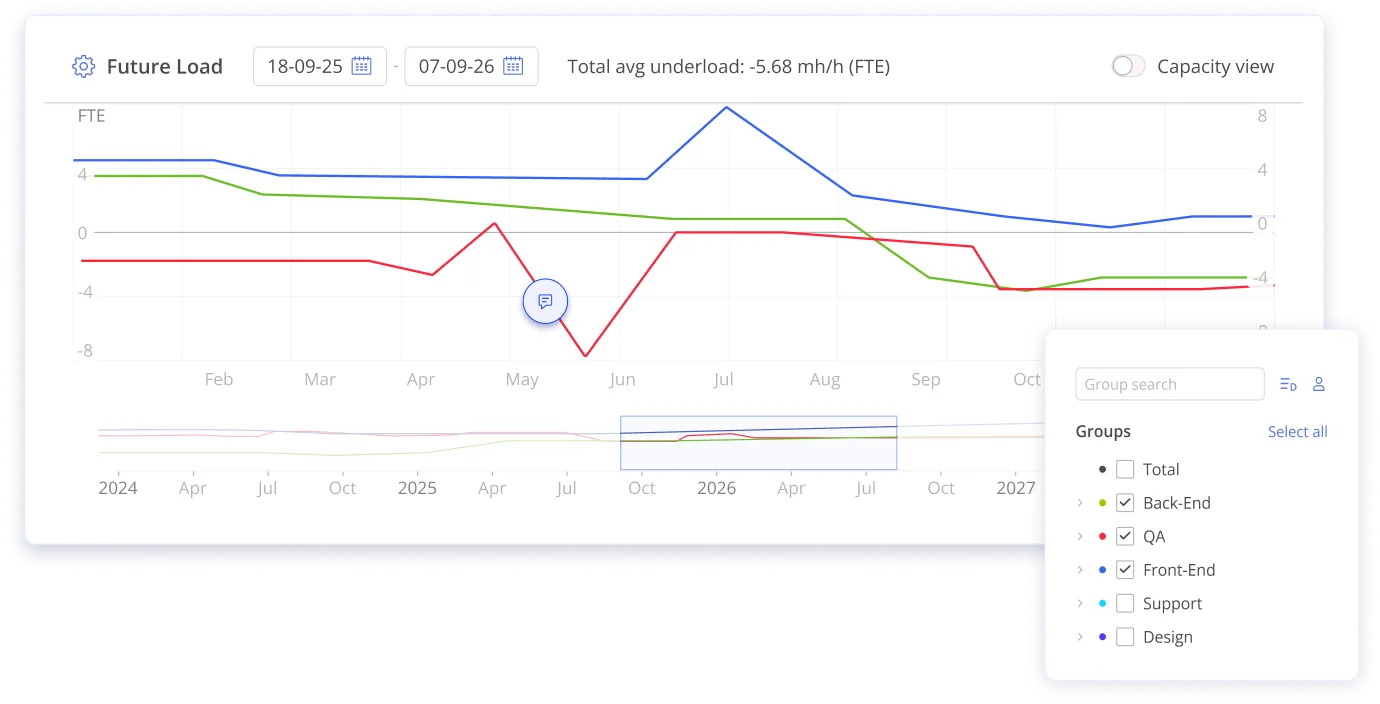
- If the graph is under the zero line, the resource or the group is underloaded (has less tasks than they could do),
- If it’s over the zero line, they’re overloaded (can’t cope with their tasks).
Why Epicflow’s Capacity Planning Software?
Epicflow’s Future Load Graph is a capacity planning software that shows how loaded your resources will be in the future based on historical data, active projects, and upon adding new projects to the Pipeline.
This helps PMOs, portfolio managers, and resource leaders forecast periods of imbalanced workloads, detect bottlenecks, and understand future resource needs.
Epicflow’s capacity planning tool facilitates intelligent planning, smooth workflows, and timely project delivery in complex multi-project environments.


Future Load Graph: Core Components for Flawless Resource Capacity Planning
Load Analysis: Learn What Overwhelms Your Resources
Get information about the tasks and projects which make your resources overloaded.

How to Analyze Load
Just select the period on the graph where you can see overload and enable the Load Analysis. In a couple of seconds you will see the list of tasks (with all related information) that are overwhelming your resource/group.

Skill-Based Task Reassignment
From this page, you can jump to the Task Card to see what competences are required for its completion and find an available resource with the same skills to reassign this task to (within the group for individual users or to another group for group analysis).
Inactive Project Analysis: Explore Your Groups’ Workload Upon Adding Extra (Inactive) Projects to the Pipeline
Carry out a more detailed analysis involving inactive projects to see how loaded your resources will be in the future if you start them. The dashed line on the graph is the load coming from the inactive projects.
Based on the analysis, you can try different variants of reassigning the constraining tasks to other resources or moving milestones to avoid overload.

Bottleneck Analysis: Be in the Know of the Most Overwhelmed Groups and Take Measures to Balance the Load
This feature of Epicflow’s resource capacity planning software lets you understand which resource group is most overwhelmed at your company and take measures to eliminate this bottleneck.

Sort Resources
Order resource groups and individual resources inside them within the chosen timeframe by the following criteria: alphabetically, by an average overload, by an average underload, peak load

Find the Best Resource
You can open a Task Card of the most constraining task and go to the Resource Allocation Advisor to find another resource for it (the one who has necessary competences, capacity, and is currently available) inside this group or outside of it.
Keep Projects Bottleneck-Free with Epicflow’s AI-Driven Capacity Planning Software
What is a bottleneck and why does it have
a harmful effect on your workflow?
A resource bottleneck is an overloaded resource, who cannot do the demanded scope of work on time, and therefore, hampers the whole workflow. The effect of a bottleneck can be dramatic:
- Missed deadlines: Together with the delayed work, this can lead to missed project due dates;
- Reduced productivity: Overloaded resources are stressed, their productivity drops, which can result in burnout.
- Affecting other resources: It makes other resources idle, which then become a bottleneck, too. This is the vicious cycle.
This is why one of the essential rules of the Epicflow approach to resource management is “Make sure not a single resource is overloaded”.
How does Epicflow’s Future Load Graph help prevent bottlenecks?
AI-powered forecasting
Predict resources’ capacity and workloads.
Overload detection
Identify the episodes of excessive workloads in the future.
Root-cause analysis
Detect what projects and tasks cause bottlenecks.
Testing scenarios
Find out optimum ways to balance workloads and eliminate resource bottlenecks.
The results: Proactive capacity management, smooth project flow, productive employees, timely multi-project delivery.
Epicflow Empowers Business Organizations Across Industries
Ensure Multi-Project Success with Demand Planning and Forecasting Software
With the demand forecasting software, you’re always in the know of how much capacity your projects require, and can easily check if your resource pool can satisfy this demand. Forget about bottlenecks and ensure your resources’ maximum productivity by balancing their workload across the entire project portfolio.
Leverage the workforce capacity planning software to be confident that you have enough resources to deliver your multiple projects successfully!


Upgrade Your Resource Management
with Integrations
Did you know that the Epicflow team has developed integrations with Jira, Oracle Primavera, and MS Project and is always ready to create a custom integration with your software?
With this integration, you’ll not only boost your employees’ productivity but also arm your management with powerful tools that help allocate resources and do complex analysis with minimum time and effort, as well as predict and avoid bottlenecks, mitigate risks, and therefore, ensure flawless management of multiple projects.
Ready to Embrace Innovation and Adopt AI-Powered
Capacity Planning Tool for Cutting-Edge Resource Management?
FAQ
What is resource capacity planning in project management?
Resource capacity planning is the process of determining the resource demand for future projects and finding ways to meet these needs. This helps project managers make sure that there are enough available team members to complete current and future projects. Resource management software platforms with capacity planning features will provide you with an upper hand in performing resource capacity planning.
What is capacity planning software?
Capacity planning software is a tool that helps organizations predict resource demand, forecast workloads, and detect bottlenecks across multiple projects. This contributes to effective project staffing, consistent workflow, and successful completion of all projects in the environment.
What are the benefits of Epicflow’s capacity planning tool?
With Epicflow’s Future Load Graph, or a capacity planning tool, you can:
- plan projects and resources intelligently,
- prevent bottlenecks and delays in the workflow,
- achieve resource efficiency and improve team utilization,
- ensure the consistent flow of multiple concurrent projects,
- meet project deadlines in complex multi-project environments.
What is the role of Future Load Graph in addressing bottlenecks?
The Graph provides visibility into future bottlenecks, while its Load Analysis features helps detect projects and resources that cause excessive workloads. This is the basis for bottlenecks mitigation.
How does Epicflow resolve bottlenecks?
First, you should detect the periods of excessive workloads on the Future Load Graph. Then, you can check what projects and tasks are overloading your resources. Finally, you can apply Epiclow’s AI-powered scenario building tool to run simulations and come up with the most optimal variants of addressing the bottlenecks (e.g., reallocating resources, rescheduling projects, etc.).
What tools does Epicflow integrate with?
Epicflow has ready-made integrations with Jira, Oracle Primavera, MS Project, and HRM systems. It’s possible to develop custom integration on a customer’s request.
Useful Resources

15 Best Capacity Planning Tools for Your Business [2025]
Capacity planning is a crucial practice for organizations aiming to optimize resources, adapt to changing business needs, and deliver projects on time and within budget.

Understanding AI Capacity Planning: An Indispensable Tool for Resource Efficiency in Multi-Project Environments
The increasing complexity of projects and diversity of resources pose the need for more sophisticated software tools for their effective management.

Top 10 Manufacturing Capacity Planning Tools
Resource capacity planning is crucial for project success, and manufacturing projects are no exception. At the same time, it can become really challenging in a dynamic and complex manufacturing environment.

Resource Capacity Planning: What, Why, and How
Making sure that a company has enough resources to complete its projects successfully is one of the primary objectives of a resource manager’s work.

Utilizing AI on Different Levels of Multi-Project and Resource Management [Webinar]
Watch the recording of an enlightening discussion on multi-project management issues with our top-notch professionals Jan Willem Tromp and Dr. Albert Ponsteen who have extensive experience in MPM and digital transformation.