

Every project looks fine. The portfolio is still late.
Project Pipeline Management Software That Shows the Cost of Delay
Epicflow project pipeline management software puts projects, people and finance on one screen. Every project is ranked by time pressure against the people you actually have, with a predicted finish date and what that date is worth in revenue, bonus or penalty. Act on a penalty while it is still a prediction.
Works as the portfolio layer above Jira, Microsoft Project and Primavera.


You know what your projects cost. Do you know what the waiting costs?
-
Most pipeline tools stop at stages and status.
A board of columns, a status color per project, and someone who rearranges the order every week.
-
Epicflow adds the two things that decide the outcome: the capacity of the teams that projects share, and the money.
Every project gets one row in the Pipeline: its rank by time pressure, its predicted finish date against the committed date, and the cost of delay. Teams keep working in their own tools. Epicflow is the portfolio layer above them.
Why do project pipelines stall?
A project pipeline moves at the speed of its bottleneck, not at the speed of its stage gates. Your bottleneck is a resource constraint: the specialists every project needs at the same time. When several projects need them in the same weeks, work queues in front of that team. More stages, more reviews or a cleaner board add no hour to its capacity.
Example · Illustrative
Take three projects that each need four weeks from the same senior test engineer in the same month.
Run them in parallel and the engineer splits time three ways: all three finish around week 12.
Run them one after another, most valuable first, and they finish in weeks 4, 8 and 12.
Dashboards miss this for two reasons.
-
Each project reports on itself and none reports on the queue they share, so the dashboard turns red too late.
-
And green is not safe: move an internal milestone and the bar turns green, while the penalty on the contract date has not moved. Only finishing the work sooner recovers it.
Meanwhile the delay has a cost. Revenue arrives later, cash comes in later, and penalty clauses start to run.
- shared team
- queue of projects
- later finish
- cost of delay (later revenue, later cash, penalty)
- tested new sequence
Send us your project list. We build a model of your own portfolio and show you, in one session, the team that holds it back and what the delay costs.
Projects, people and finance on one screen
You leave money on the table when projects, people and finance are managed apart. Each looks under control on its own, and the money is lost between them. The Pipeline puts all three on one screen, where the portfolio is managed, not only viewed.

Add any column next to the Gantt area, including your own custom fields and attributes, and the layout is saved for you: a portfolio director reads value and risk, a PMO lead reads dates, Finance reads budget. Sections keep active, inactive, closed and archived projects apart. Under the Gantt, a load strip shows each team's load against its capacity as you change dates.
Per project, the Pipeline shows revenue, approved budget, actual costs and remaining budget, so an overrun stands out while it can still be managed. Each project carries its bonus and penalty scheme, and the amount is shown twice: on the committed date, and on the date Epicflow predicts. Next to it, one figure answers whether finishing is still worth what is left to spend: contract value against the money still to spend, shown as a multiple beside ROI. Project financials explained Roles decide who sees and edits what, down to the financial columns, so budget and contract figures show only to the people you allow.

Select several projects and act on them together. Create a project, group, task or milestone from one button, and edit dates, links and durations directly on the Gantt bar. Quick Edit Mode lets you create and edit projects with key combinations or the graphic interface. Project pipeline software filtering goes down to budget, phase, milestone, hour ranges and info fields, and you save the filters you use for weekly reviews. Each project keeps a log of who changed what, when, and from which value to which.
Act on a penalty while it is still a prediction
Contracts in aerospace, defense, shipbuilding and engineer-to-order carry delivery clauses. Most tools record the penalty after the date is missed. Epicflow prices it while you can still prevent it.
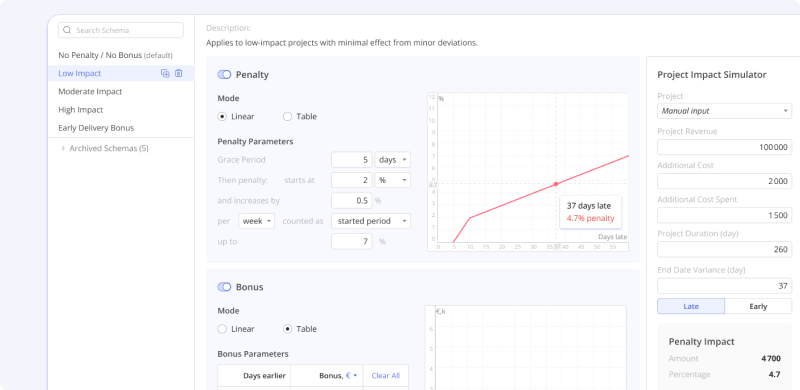
A bonus and penalty scheme sets the grace period, the starting rate, how fast it escalates and where it caps, linear or stepped, with the bonus side set separately. The Project Impact Simulator shows what a scheme does to a project before you apply it.

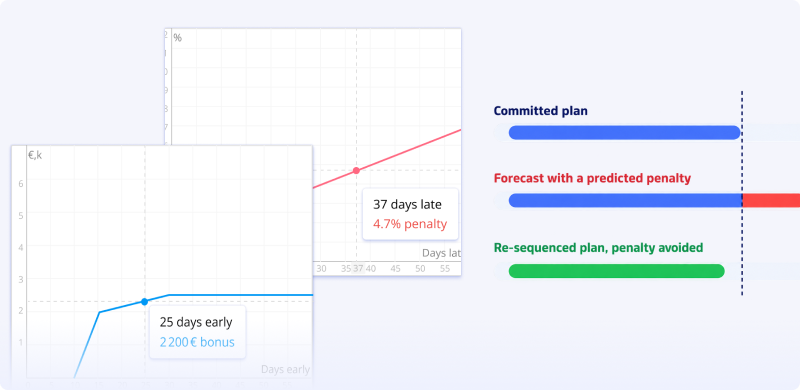
Epicflow predicts each project's finish date from the capacity of the teams it shares. Days late against the committed date become a predicted penalty. Days early become a predicted bonus.
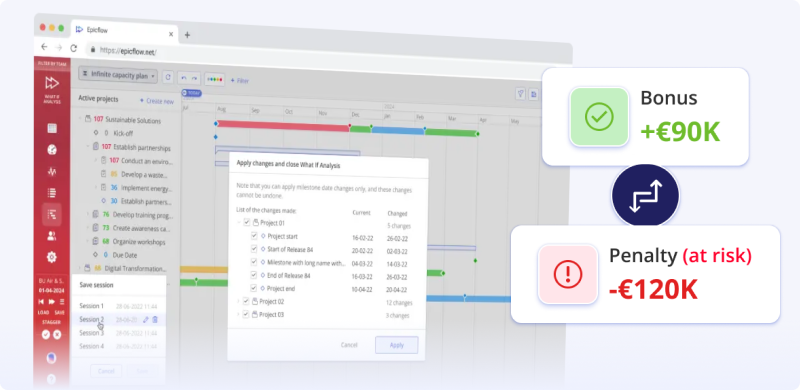
Re-sequence, pause what can wait or move people in a What-If, and see the predicted penalty shrink before the live plan changes.

No penalty clause in your contracts?
The cost of delay is still there: revenue and cash that arrive later. Epicflow's invoice and cash flow forecast follows the same predicted dates. See how a delivery date changes the financial picture.
If you want the technical names: what each week of delay costs is what Stephen Devaux called drag cost, and the worth-finishing figure is RRI, return on remaining investment. See how Epicflow lets you manage projects as investments.
Keep the right project on top
Intelligent project management: high-priority projects are always on top of the pipeline
In Epicflow project pipeline management software, projects are ranked by time pressure: the one that needs the most management attention sits at the top. Priority is calculated across the whole portfolio from the dependencies between projects and the safety time each one has left, following Critical Chain project management (CCPM) principles, with business value and the cost of delay weighed in. Not submission order, and not whoever escalates loudest. You choose how far the forecast follows time pressure or business value. When options are too close to call, people decide.
See the knock-on effect of every change
With Change Sensitivity in Epicflow pipeline project management software, nothing is recalculated by hand. When a project changes, priorities across all projects recalculate. Feasibility colors show where the plan is being eaten into: red when a milestone is no longer feasible, yellow when its buffer is shrinking, green and blue when there is enough safety time to deliver.
| Signal | What it tells you | Decision it supports |
|---|---|---|
| Priority rank | Which project is under the most time pressure, across the portfolio | Where the bottleneck team works next |
| Feasibility color | How much safety time is left | Act now, or watch |
| Predicted finish date | When the project can really land with the people you have | Keep, move or renegotiate a commitment |
| Predicted bonus or penalty | What that date is worth under the contract | How much a re-sequence is worth |
| Worth-finishing multiple | What the rest of the spend still buys | Which project gets the next scarce hour |
Find the bottleneck and test the fix
Large organizations manage high-volume project pipelines with three things: one priority order across all projects, a forecast of each shared team's load months ahead, and a way to test re-sequencing before committing. In multi-project resource management, that forecast decides whether a date holds.
-
Find the team everything waits for.
The Future Load graph forecasts each team's load and output at any date ahead. Bottleneck Analysis ranks teams by overload, so the bottleneck sorts to the top, and Load Analysis shows which projects put it there.
-
Know the cost of delay.
Compare the plan as if every team had unlimited capacity with the prediction built around the people you have. The gap between the finish dates is what your bottleneck costs, in weeks and in money.
-
Test the fix.
Re-sequence, pause what can wait, move people, hire where it counts or add AI capacity. Try each in a What-If before the live plan changes.
-
Commit and run.
The chosen plan becomes every team's priority list, and progress flows back into the forecast.

-

Predict delivery dates with Pipeline Leveling
Pipeline Leveling builds a resource-constrained prediction of the whole portfolio and gives every project a predicted delivery date. Before you say yes to a new project, it shows when that project can really land. Approving a project and starting it are separate decisions: approve now, release later, when the capacity is there.
-

Choose the best sequence with project forecasting pipeline software
The Performance tab of the Dashboard shows project statuses, hours in execution, planned delivery dates and how many projects will finish on time. If dates will be missed, stagger start dates or put more people on the largest tasks, and compare sequences on the result that matters. Auto-Planning calculates priorities and durations for you. Manual Planning lets you place work yourself where a commitment is fixed.
-

Explore project schedules in a Gantt view with pipeline project management software
Open the Gantt chart inside the Pipeline to see schedules, milestones and dependencies, with predicted dates marked and late milestones in red.
Who uses the Pipeline, and for what
-

Head of PMO
"Status reports show green, until suddenly everything is red."
One view of every project, ranked by time pressure, with a record of every change
-

Portfolio Director
"Every project is top priority, so none of them are."
Priorities calculated across all projects at once, and scenarios tested before committing
-

Finance
"Late projects burn money invisibly."
Revenue, budget and the cost of delay per project, on the committed and the predicted date
-

Resource Manager
"The same key people are fought over every week."
Load per team months ahead, so conflicts show before they bite
-

Engineering Lead
"Plans are built on estimates nobody believes."
Delivery dates that come from real capacity
How does a project pipeline move from intake to delivery?
Most pipeline software for project management describes the same stages: intake, evaluation, approval, planning, execution and reporting. The stages are right. What they leave out is the question every stage shares: do we have the people for this, and what does it cost if we wait?
Which requests deserve a closer look?
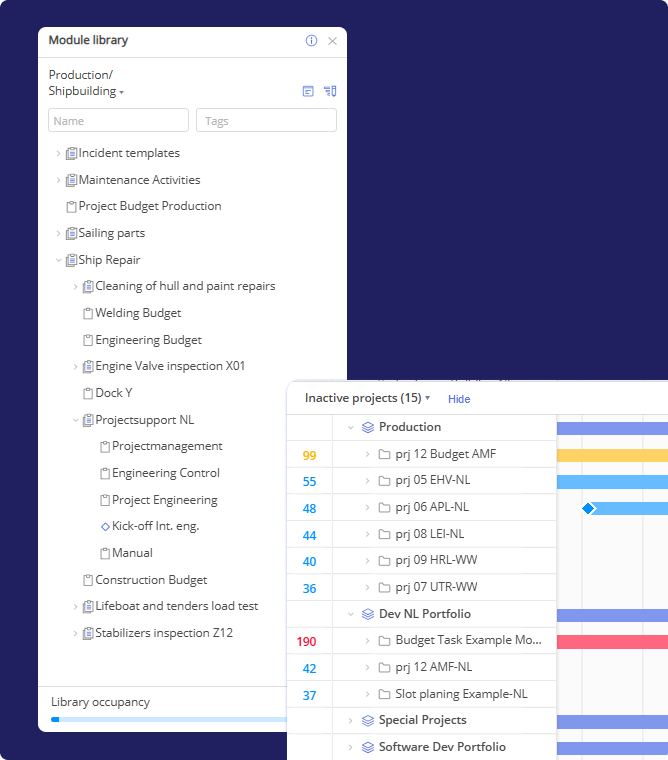
Candidate projects wait in an inactive section, outside live priorities. New projects start from saved plan modules in the Module Library.

Which work deserves scarce capacity?
Priority, business value and the cost of delay, across all projects at once.

When should approved work start?
Pipeline Leveling shows when a new project can really land. Approval and start stay separate decisions.

Do we have the people and skills?
The Future Load graph forecasts load and output per team, months ahead.

What moves first now that something changed?
Priorities recalculate. What-If analysis tests the fix.

What is at risk, why, and what does it cost?
One configurable Pipeline view with feasibility colors, budget and predicted bonus or penalty.



Use Epicflow alongside Jira, Microsoft Project and Primavera
Jira users don't have to switch, and neither do Microsoft Project or Primavera teams. Ready-made integrations bring their work into one portfolio model, where Epicflow adds what those tools do not hold: priority across all projects, load per shared team and the cost of delay. See the Jira integration
Epicflow fits
-

engineering-intensive and mission-critical organizations
-

that run many projects through shared pools of specialists
-

with a PMO accountable for delivery
It is less relevant for single-project task tracking, small teams with little shared work, sales CRM pipelines and CI/CD pipelines.
See how it works as PMO software.
Proof from an overcrowded pipeline
KPN sold about 150 projects for every 70 it delivered. Work in progress grew into the thousands and delivery times doubled. The team focused on the bottleneck, balanced the load and cut the number of projects in flight. In less than a year, on-time delivery rose from 18% to 80%, lead time halved and late orders fell by 80%.
"On-time delivery is not a myth. We're now able to deliver on time and improve our service in a faster and more efficient way."
Edwin Kuiper, Partner Manager, KPN
-

18% → 80%
on-time delivery
Read the KPN story
Turn your project pipeline into better portfolio decisions
A project pipeline moves at the speed of its bottleneck, not at the speed of its stage gates. Epicflow project pipeline management software ranks the work against real capacity, shows the cost of delay and tests the fix before anyone moves. Act on a penalty while it is still a prediction.
Send us your project list. We build a model of your own portfolio and show you, in one session, the team that holds it back, two or three ways to change the plan, and what each does to dates and money.
Frequently asked questions about project pipeline management software
What is project pipeline management software?
Project pipeline management software helps PMO and portfolio leaders decide which projects to start, which to finish first and when each one can realistically land, when many projects share the same people. It tracks every project from intake and approval through delivery and ranks the whole portfolio. Epicflow adds the capacity of shared teams and the cost of delay to that ranking.
What is a project pipeline in project management?
A project pipeline is the ordered flow of proposed, approved, active and finishing projects across a portfolio. Unlike a task list for one project, a pipeline of projects shows how many initiatives compete for the same people, time and budget. Where specialists are shared, time pressure and capacity set the real order, not submission date.
How do you manage a project pipeline?
Collect requests in a consistent format, rank them by value and capacity across the whole portfolio, forecast the load each project puts on shared teams, test changes before committing, and re-sequence as conditions change. A project pipeline template helps with intake. It cannot tell you which project the bottleneck team should work on next, or what waiting costs.
What is the difference between project pipeline management and project portfolio management?
Project portfolio management (PPM) is the broader discipline: choosing, governing and reporting on the projects an organization runs. Project pipeline management controls how work enters and moves through the portfolio, in what order and with which people. Portfolio pipeline management matters most when projects share specialists, because then the order decides delivery dates.
What causes a project pipeline to stall?
Competition for shared resources. Several projects need the same scarce specialists in the same weeks, and work queues in front of that team. Each plan can look fine on its own while the portfolio is late. A stage view shows the queue but adds no capacity: the fix is a different order, fewer projects in flight, or more capacity at the bottleneck.
How does Epicflow prioritize projects in the pipeline?
By time pressure across the whole portfolio: the dependencies between projects, how much safety time each one has left, its business value and the cost of delay. When a project changes, priorities across dependent projects recalculate, so the project that needs attention most stays on top. You choose how far the forecast follows time pressure or business value.
What tools are used for project pipeline management?
Project pipeline management tools fall into a few groups: intake forms, PPM platforms for prioritization and governance, capacity planning tools, scenario analysis and reporting dashboards. To track multiple project pipelines in one place, look for portfolio-wide priority, team load forecasts, what-if testing, the cost of delay and integration with the tools your teams already use.
Can project pipeline management software work with Jira or Microsoft Project?
Yes. Epicflow works as the portfolio layer above Jira, Microsoft Project and Oracle Primavera through ready-made integrations. Teams keep planning and executing in their own tools. Epicflow adds what those tools do not hold: priority across all projects, load per shared team and the cost of delay.
How much does project pipeline management software cost?
It depends on the number of users, the deployment and the services you need. Epicflow publishes its platform plans on the pricing page; Enterprise plans start at 50 users. To judge the value first, send us your project list: we build a model of your own portfolio and show you what your bottleneck costs.