A Quick Guide to Essential Project Management Metrics
 Victoria Sokolova
.
February 17, 2026
.
Project Management
.
23 mins READ
Victoria Sokolova
.
February 17, 2026
.
Project Management
.
23 mins READ

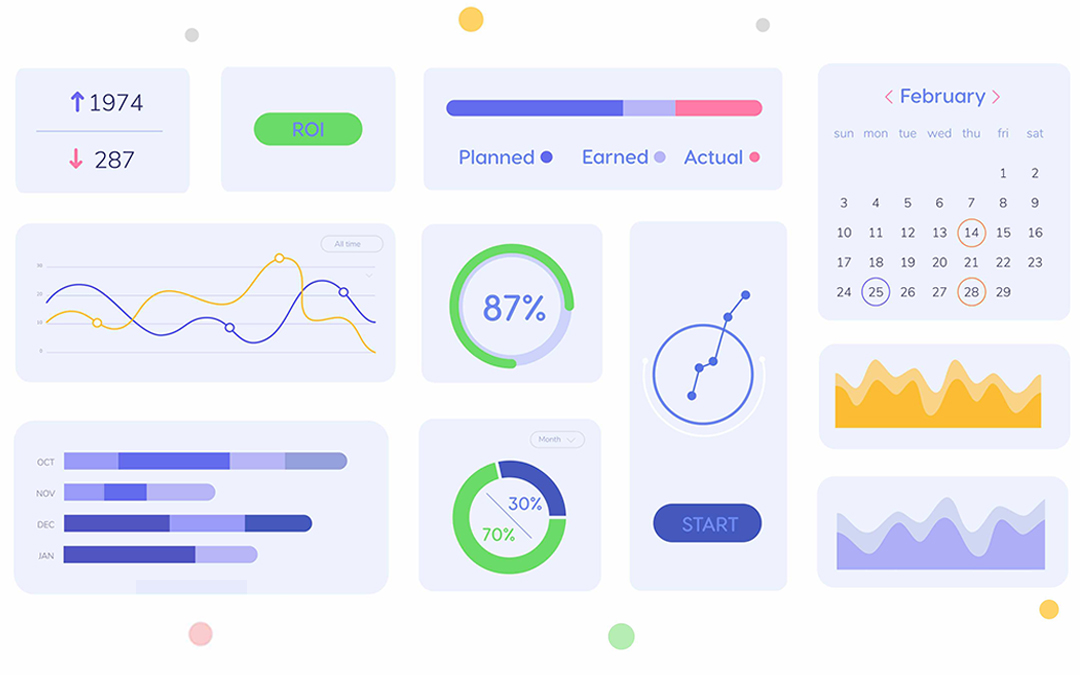
When managing a project, it’s vitally important to regularly monitor its state: whether or not it has deviated from the approved schedule and budget; how much work has been completed and how much is left; how efficiently your resources are utilized, etc. This is where project management metrics come into play – they provide project managers with useful insights as to a project’s “health”.
What are these metrics, what are they used for, and how to calculate them? Let’s delve into these issues.
Key Takeaways:
- Project management metrics involve data sets that help you assess project success from different perspectives.
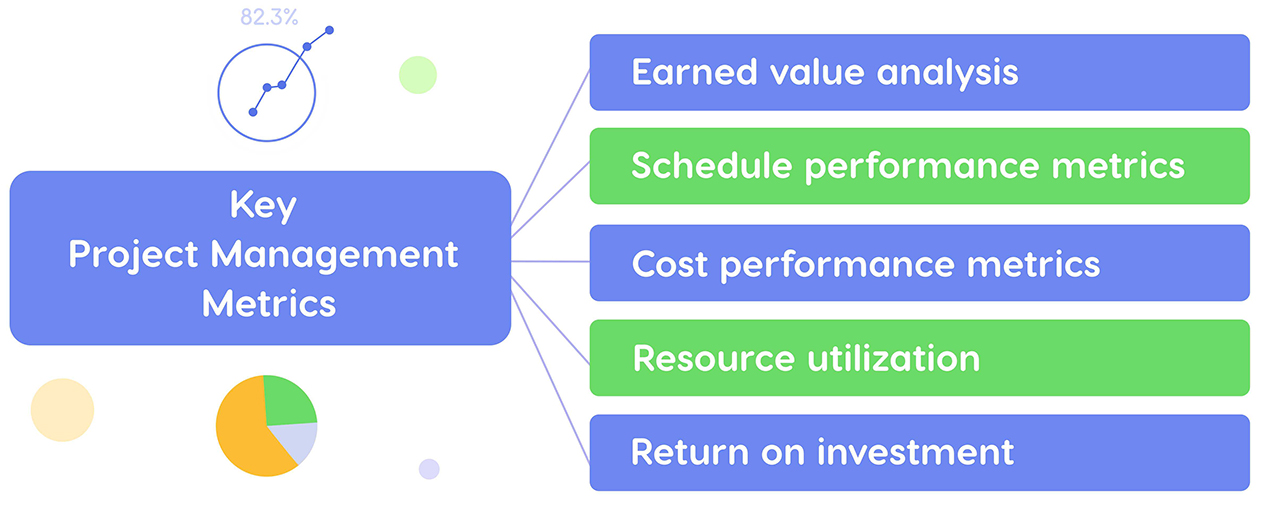
- The most common project management metrics examples include earned value analysis, schedule performance metrics, cost performance metrics, resource utilization, and return on investment.
- In a multi-project environment, the key metric and the indicator of the overall project environment health is resource performance.
What are project management metrics and why do you need them?
Project management metrics are specific data sets used to assess a project’s success [1]. They make it possible to estimate the state of a project’s timeline, scope, budget, quality, and other indicators. It’s important to check these metrics regularly, upon reaching milestones, so that you can make sure that the project hasn’t gone off the rails.
With the essential PM metrics, a project manager and/or a company’s leadership can gain insight into project and resource performance, and make sure that it will be completed in line with the plan and an organization’s business needs.
Importance of project management metrics
Let’s summarize the main reasons to apply project management metrics.
- They allow you to assess the state of a project.
- They give insight into the effectiveness and efficiency of your project management efforts.
- They help detect issues and inefficiencies in the workflow.
- They give an opportunity to improve the final deliverable if necessary.
- They can be used for planning and estimating future projects.
Let’s discover the most common metrics and ways to calculate them.
What are the most common project management metrics?
Before we dive into examining essential PM metrics, it’s important to note that applying them will only be effective when they are relevant to the business or project management needs. The other important prerequisite for the effective use of metrics is that they must be accurately measurable and based on data. It means that you don’t need to take all the indicators listed below and calculate them, but choose only those that will provide maximum value.
So, what project management metrics can we use?
Earned value analysis
The earned value analysis (EVA) helps a project manager estimate the amount of project work that has been actually completed. It can also help predict the final project result by comparing the actual work performed with what has been planned. EVA covers the following three indicators.
Planned value
The planned value shows the amount of work that must be completed by a certain point of a project schedule. As long as the planned value is calculated before the start of a project, it can serve as a baseline.
Earned value
As opposed to the planned value, the earned value indicates the amount of work that has been actually completed: in other words, how much value has been earned with the funds spent. This indicator is also called the budgeted cost of work performed.
Actual cost
As the name suggests, actual costs indicate the amount of money actually spent up to date.
In addition to being the components of earned value analysis, the above-mentioned three indicators are the basis for calculating other important metrics that we’ll describe in the next subsections.
Schedule performance metrics
Delivering projects on time is one of a project manager’s main goals. To make sure that the due date isn’t going to be missed, you need to monitor the schedule performance regularly. There are two indicators that help you understand the project’s progress with regard to the approved schedule. You can find the descriptions below.
Schedule variance
SV indicates whether a project is ahead of or behind the schedule baseline. It’s a schedule performance indicator that shows the difference between the earned and the planned value. You can calculate the schedule variance with the following formula:
SV (Schedule Variance) = EV (Earned Value) – PV (Planned Value)
How to interpret the calculation results?
- If the result obtained equals zero, the project is on schedule;
- If the figure is positive, the project is ahead of the schedule;
- If the figure is negative, you’re behind the schedule.
Schedule performance index
SPI shows how efficiently the team members are accomplishing work on a project with regard to its schedule. SPI can be used along with the cost performance index to forecast final completion estimates.
You can calculate SPI with the following formula:
SPI (Schedule Performance Index) = EV (Earned Value) / PV (Planned Value)
Here’s how you can interpret the results:
- If the number obtained is 1, the project is on schedule;
- If the result is less than 1, the team members have completed less work than has been planned; the project is behind the schedule;
- If the figure is more than 1, the team members have accomplished more work, and the project is ahead of the schedule.
The difference between these two metrics is that schedule variance shows the deviation of the actual work from the approved schedule, while SPI indicates the ratio of performed to scheduled work.
Cost performance metrics
The following cost performance metrics help a project manager understand whether the project is on budget, and if not, how it has deviated from it.
Cost variance
To get an idea of how the actual costs vary from the planned budget, you can calculate cost variance (CV). It shows the difference between a project’s earned value and its actual cost, i.e., whether a project is under or over the budget. The cost variance is calculated with the following formula:
CV (Cost Variance) = EV (Earned Value) – AC (Actual Cost)
The results obtained can be interpreted as follows:
- If the result equals zero, the project is on budget;
- If it’s positive, you’re under the approved budget;
- If the result is negative, the project is over the budget.
Cost performance index
The cost performance index (CPI) shows the value of completed work in relation to the costs spent. It’s calculated as follows:
CPI (Cost Performance Index) = EV (Earned Value) / AC (Actual Cost)
How to interpret the results obtained?
- CPI less than 1 indicates cost overrun;
- CPI more than 1 indicates cost underrun;
- If CPI equals 1, earnings and spending are equal.
Both metrics have the same purpose. The only difference between them is that CV indicates the difference in the amount of money, while CPI is a ratio. [2]
Resource utilization
Apart from analyzing project metrics, it’s also important to understand the situation with your resources. One of the resource-related metrics is resource utilization that shows how much time the team members work on billable tasks (those that are related to the project). This will give an idea of how efficiently resources are utilized at a particular moment, and how to budget them for future projects. Resource utilization is calculated with the following formula:
Resource Utilization = (Billable Hours / Available Working Hours) x 100
The results obtained can’t be 100% because not all team members’ time is billable. For example, the time spent for meetings, training, paperwork, etc. isn’t billable.
Return on investment (ROI)
ROI is not a pure project management metric, but it’s widely used to find out whether the project costs have been effectively used and generated the expected profit. In addition, it can indicate whether a project is worth working on, i.e. whether it’s going to return the desired profit. In project management, you can calculate ROI with the following formula:
Return on Investment = (Benefit – Project Cost) / Project Cost
Here’s how you can interpret the results obtained:
- If the value is more than 1, the project is profitable;
- If the result is less than 1, there will be no profit;
- When it’s zero, there will be neither loss nor gain.
Note that the last two results require making decisions regarding the practicability of further work on a project.
Calculating these project management performance metrics for small projects is no problem, but what if you have several of them in the pipeline? It’s rather difficult to analyze metrics for each particular project and at the same time see the big picture of the whole project environment.
Fortunately, modern project and resource management solutions have a variety of tools to track various project metrics and assess project and/or resource performance. Let’s examine the example of Epicflow, a multi-project resource management solution, and the way it deals with performance tracking.
Analyzing project and resource performance: Epicflow’s approach
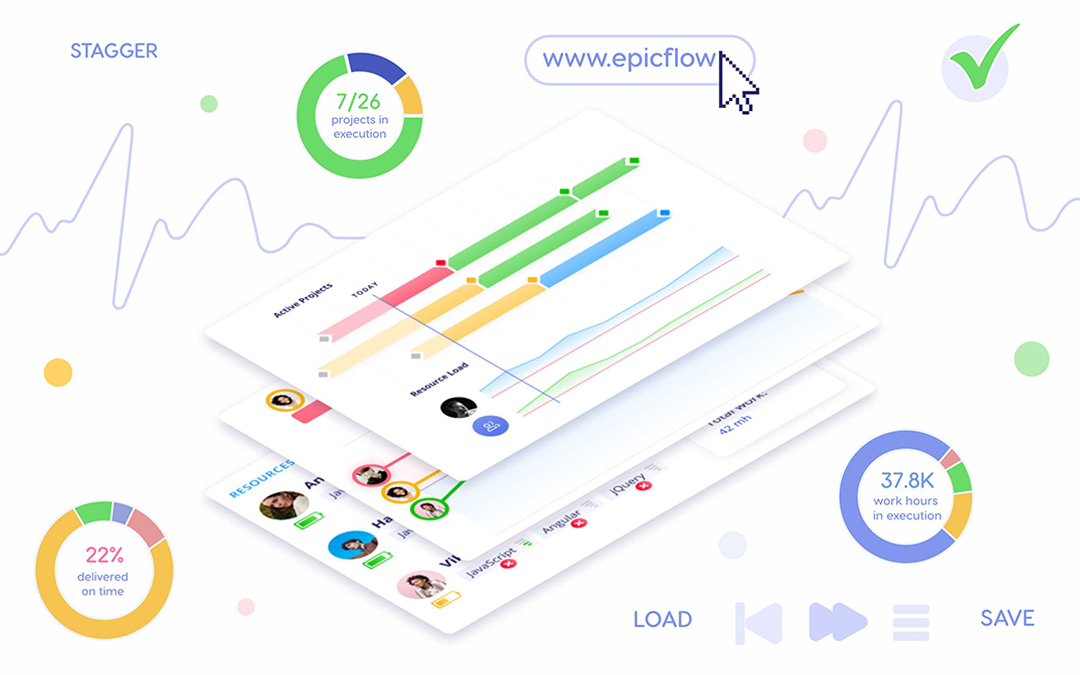
Based on 20+ years of multi-project management experience and research in this domain, Epicflow’s co-founders have come up with a unique approach to managing concurrent projects and their shared resources. It has become the basis for Epicflow’s functionality which lets businesses deliver maximum output without overloading their people.
When it comes to performance assessment, we at Epicflow believe that first of all, you should focus on resource performance, not project progress. There’s one thing you should be fully aware of:
The state of the project level is a reflection of what has been going on at the resource level.
It means that the root causes of problems on the project level are hidden at the level of resources. At the same time, issues at the resource level aren’t immediately reflected on the project level – they will manifest themselves over time when it can be difficult to improve things.
In a multi-project environment, tracking resource performance is an absolute must: one unnoticed bottleneck can put the brake on the whole workflow due to dependencies between projects.
Read more: Tracking Performance: Switching from Project to Resource Level
Now let’s examine what performance tracking tools are available in Epicflow.
Resource performance
With our solution you can:
- Check the output delivered by the project team within a certain timeframe;
- Examine your teams’ progress against the approved budget;
- Analyze your resource groups’ output in relation to their capacity as well as how much work has been completed with and without a delay, which is especially important when you have a bottleneck in the flow and need to find its cause.
Project performance
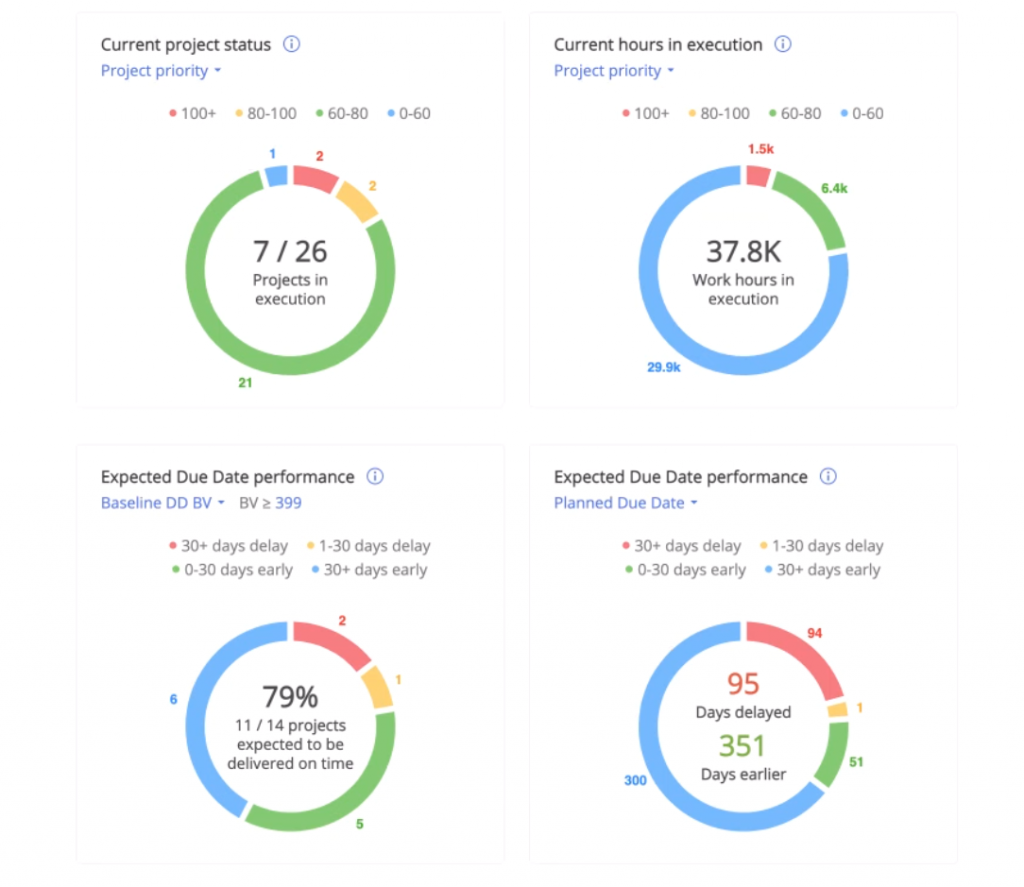
Focusing on team performance doesn’t mean that we neglect the project level. Epicflow has a number of graphs that help assess the state of projects from multiple perspectives at a glance. Here are some examples.
- You can check the state of each project in your environment in relation to the remaining time and budget buffer – how much you’ve already consumed and how much is left.
- You can also predict the due date performance – how many projects will be delivered on time and with a delay and how many days delay you’ll have based on the current state of your project setting.
Therefore, with Epicflow you don’t need to gather information and perform calculations to assess project and resource performance. In our system, you’ll get essential information with a few clicks.
If you want to learn more about Epicflow’s capabilities to keep you on top of your multiple projects and their shared resources, don’t hesitate to request a call with our experts.
Final Thoughts
Project management metrics turn intuition into insights: it shows what’s really happening across projects. Tracking core project metrics like schedule and cost performance, earned value, resource utilization, and ROI allows organizations to gain a multidimensional view of project success. However, in multi-project environments, resource performance becomes the key health indicator: when resources are balanced and productive, projects run smoothly, risks and bottlenecks are minimized. Therefore, the right metrics don’t just measure performance, they enable better decision making and successful delivery.
References
- A Guide to Project Management Metrics (With Examples). Retrieved from: https://www.indeed.com/career-advice/career-development/project-management-metrics
- A Guide to the Project Management Body of Knowledge. 5th ed. Retrieved from: http://faspa.ir/wp-content/uploads/2017/09/PMBOK6-2017.pdf
Frequently Asked Questions
What are metrics in project management?
Metrics in project management are quantitative indicators used to track, analyze, and evaluate performance, progress, and project outcomes.
Why are project management metrics important?
They help project managers and executives make data-driven decisions, identify risks, measure project success, and ensure that projects stay on the right track.
What are the most important project management metrics?
The most commonly used metrics for project management include schedule performance, cost performance, budget variance, earned value analysis, resource utilization rate, and ROI.
Which metrics are the most critical in the multi-project environment?
Resource performance is the most essential metric in multi-project management. This is explained by the fact that resources are shared across multiple projects and can easily become bottlenecks for the whole multi-project setting not managed properly.
When are metrics collected in the project?
Project metrics are collected throughout the project lifecycle. At the project initiation stage, project managers establish baseline metrics. During project execution, they track progress, performance, risks, and resource utilization. At the project closure, you should evaluate final performance and analyze lessons learned.
How to track project management metrics?
To track project management metrics, you need to determine key performance indicators, collect real-time data from project schedules, budget, and resources as well as analyze this data with project dashboards and reporting tools.
How often should project management metrics be reviewed?
Project health metrics should be reviewed regularly: e.g., weekly or biweekly for projects and monthly for portfolio level. Frequent analysis helps identify problems early on and take timely corrective actions.
Can project management metrics predict project failure?
Yes. You can identify negative trends in schedule, cost, or resource performance that can serve as early warning signs.
How does project management software support metric tracking?
Modern project and portfolio management tools like Epicflow automatically collect data, visualize metrics in dashboards, and provide forecasts to facilitate faster and more informed decision making.
What is the difference between project management metrics and portfolio management metrics?
Project management metrics focus on how well an individual project is being executed; it measures performance against scope, schedule metrics, cost, quality, and resources. Portfolio management metrics operate at a higher strategic level; they deal with overall business value, strategic alignment, risk balance, resource utilization across the portfolio, ROI, and portfolio performance evaluation.