Project Profitability Analysis: How Delivery Dates Change the Financial Picture
 Mykhailo Kulakov
.
Updated
.
Project Portfolio Management
.
27 mins READ
Mykhailo Kulakov
.
Updated
.
Project Portfolio Management
.
27 mins READ

What projects should you accept and which ones can you decline? Many companies take every project that comes their way, and that might be a good solution in some situations. But at some point, you’ll have to make difficult choices as your company resources are limited. One way of making that choice is analyzing project profitability.
Project profitability analysis helps leaders understand not only how much profit or margin a project has produced, but how that financial picture may change before delivery. In resource-constrained portfolios, predicted end dates can change bonus/penalty exposure, revenue, and profit—so the decision is not simply which project looks most profitable today, but where the next scarce hour can protect the most value.
In this article, we’ll explore what project profitability analysis is, what metrics and formulas you can use, how to calculate profitability, and how to turn the analysis into better portfolio decisions.
Key takeaways:
- Project profitability analysis measures how profitable a new project can be or a past project was.
- It’s important for financial forecasting and project prioritization.
- In deadline-sensitive portfolios, profitability can change when predicted delivery dates trigger bonuses or penalties.
- When projects compete for the same scarce specialists, compare the value an intervention can protect with the constrained capacity it consumes—not only the largest revenue, margin, or sunk spend.
What is Project Profitability Analysis?
Project profitability analysis is the process of measuring how profitable a new project can be through examining multiple financial metrics. The metrics used for this analysis can include:
- Project profitability index formula.
- Return on investment.
- Utilization rate.
- Rate of realization.
A more complete definition is: project profitability analysis evaluates whether a project’s revenue and other commercial value exceed its costs, usually through profit, margin, variance, and forecast metrics. In deadline-sensitive portfolios, the analysis should also consider how predicted delivery dates may change bonuses, penalties, revenue, and profit.
Why is project profitability analysis important?
Analyzing project profitability is important for making strategic decisions because it allows project managers to:
- Understand which projects bring in more net profit.
- Create a data-backed pricing strategy.
- Prioritize projects based on profitability.
- Plan financials more accurately.
- Increase financial health of the organization.
- Keep predictable margins.
- Identify schedule-linked commercial exposure early enough to intervene.
Where is project profitability analysis relevant?
Analyzing project profitability is relevant for commercial projects, but the basis of the calculation depends on the business model. Client-oriented work is easiest to analyze because revenue and contractual terms are explicit. R&D, compliance, and internal transformation work can still be assessed, but the value side may need to use expected benefit, avoided cost, or strategic value rather than direct client revenue.
How to measure and determine profitability metrics
How to measure profitability? There are multiple metrics you can use. Here’s an overview of the most common and most effective ones.
Project profitability formulas and metrics
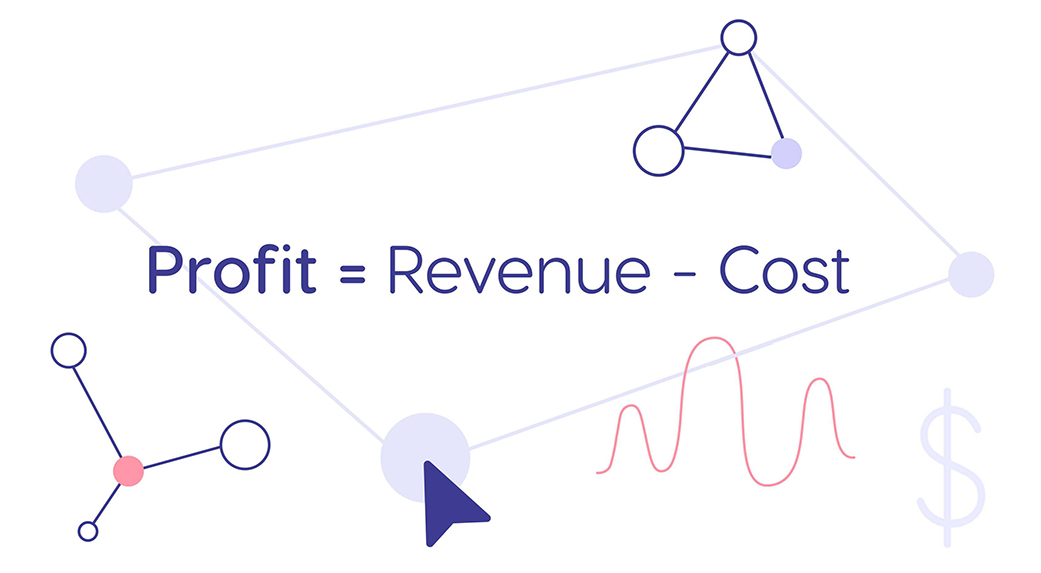
The most basic project profitability formula is this:
Project profit = Revenue − Project costs
But calculating true profitability is not as straightforward as this simple formula. You need to create a set of measurements and standards that will be used consistently across the organization to reach the most accurate representation of profit for your company.
Now, let’s take a closer look at essential profitability equations for financial tracking
Gross profit
Gross profit is a metric that looks at profitability only taking into account the costs directly associated with creating a good or a service. The formula for determining profitability with gross profit is pretty simple:
Gross profit = Revenue - Direct costs.
The direct cots typically include billable hours and materials. For example if the project pays $10,000 and requires $2,000 in materials, and $3,200 in employee compensation, the gross profit calculation would look like this:
$10,000 - $2,000 - $3,200 = $4.800
Net profit
Net profit is a more accurate profit projection that takes into account the overhead costs like:
- Admin staff payroll.
- Marketing expenses.
- Facility costs.
- Depreciation.
- Amortization.
- Loan payments.
The formula for calculating profitability with net profit is:
Net profit = Gross profit - Overhead expenses.
The most important thing in calculating net profit is understanding your company’s overhead expenses and distributing them between the projects. The unit of distributing the overhead across projects is called allocation base.
The easiest way to define it is to base your calculations on the total number of hours available. You can also make total revenue or total budget spent on your allocation base. Allocation base helps you distribute the overhead between projects based on what share of company resources a project takes. The formula for calculating overhead distribution is as follows:
Overhead = (Project allocation base/Total allocation base) * Total overhead
In the example above, let’s say the company’s total monthly overhead that includes rent, utilities, and admin payroll comes to $25,000 and the resource capacity is at 700 work hours per month. The project in question takes 100 hours to complete. In this case, the calculation of overhead would look like this:
(100/700) * $25,000 = $3,571
The net profit calculation would look like this:
$4.800 - $3,571 = $1,229
Test different approaches to calculating the allocation base as they often lead to slightly different results. For instance, using the total number of work hours available at a company might produce a skewed picture in cases where the company doesn’t work at full capacity.
Allocation methods can change the result, so use a consistent finance-approved basis when comparing similar projects.
Profit margin
Profit margin is one of the most telling metrics in profitability analysis as it represents profit as a percentage of the revenue. The formulas for it are:
Gross profit margin = gross profit/revenue * 100
Net profit margin = net profit/revenue * 100
For the example we’ve been using, the numbers would be
$4,800/$10,000 * 100 = 48%
$1,229/$10,000 * 100 = 12%
This metrics helps you benchmark the profitability of a project against your average performance and goals to understand whether you should start or discard it. Renegotiating the payment is also one of the options if you see that the profit margin is not in line with your expectations.
A profit margin in project management is most useful when projects use the same cost model and are commercially comparable. A predicted delay can still change the revenue side through bonuses or penalties.
Return on investment
ROI is one of the most widely used business metrics and is applicable to multiple areas of business, from R&D to marketing investments. In project management, it can show how much money you can expect to get back from every dollar spent. The ROI formula for project profitability goes like this:
ROI = net profit/total costs * 100
For the example we’ve used, the ROI would be:
$1,229/($5.200 + $3,571) * 100 = 14%
There are multiple ways to approach the ROI formula, though. In this example, we’ve added overhead, but you might omit in some cases:
- A project manager that doesn’t have control over overhead.
- Only project-level ROI is relevant.
- Other projects’ ROIs are calculated for direct cost and including overhead will prevent fair comparison.
For some projects, you might need to calculate other similar metrics.
- Payback period. Calculates how many years it would take for cost savings to break even with investments. Useful for internal R&D projects.
- Cost-benefit ratio. Calculates ROI of projected benefits of a project, not always represented as direct payment. Useful for R&D projects, but relies on accuracy of benefit evaluation.
Read more: How to Calculate ROI for a Project: Formula, Examples & Expert Tips
Rate of realization
If your company invoices the client by the hour instead of charging a fixed fee, rate of realization is a good metric to use. It finds the ratio of hours worked to hours billed to your client. The formula is:
Rate of realization = hours billed/hours tracked * 100
If this metric is lower than 90% this indicates that employee time that your company pays for is written off too often and not charged to the client. This shows either a billing or performance issues.
A low realization rate can indicate write-offs, pricing issues, or delivery inefficiency. The right benchmark depends on your billing model rather than a universal threshold.
The metrics that make profitability actionable
|
Metric |
Decision use |
|---|---|
|
Actual Costs / Remaining Budget |
Shows current spend and monetary budget headroom. |
|
Predicted end date |
Connects shared-resource constraints to future delivery. |
|
Actual / Predicted Bonus or Penalty |
Makes schedule-linked contractual exposure visible. |
|
Actual / Predicted Revenue and Profit |
Shows current versus forward commercial state. |
|
Constrained hours required |
Shows how much scarce specialist capacity an intervention consumes. |
How to perform a project profitability analysis for Data-driven Reporting
Let’s look at a step-by-step process you can use to calculate project profitability. You can omit or add steps to fit your internal workflows and governance structures.
For a forward-looking decision view, use six steps:
- 1. Define the economic basis: revenue, cost model, baseline date, and any contractual bonus/penalty rules.
- 2. Validate inputs: scope, labor rates, additional costs, remaining work, and shared-resource availability.
- 3. Calculate the actual position: current revenue, cost, profit, margin, and budget variance.
- 4. Forecast delivery and commercial changes: predicted end date, predicted bonus/penalty, revenue, and profit.
- 5. Trace the change to its cause and retest the remaining investment, excluding sunk cost from the continue/stop decision.
- 6. Compare rescue, acceleration, resequencing, continuation, or stop—and monitor the forecast after the choice.
Create revenue projections
For projects with a fixed fee, this step is not necessary. With those, revenue is the sum a client agrees to pay before the project starts. For projects that rely on hourly billing or another type of payment, you may have to calculate the revenue.
Assess direct and overhead costs
A crucial step in profitability analysis is assessing the costs that go into the project. For many industries, human resources will be the main source of expenses.
Estimate required hours with the people doing the work and compare the estimate with historical data from similar scopes. Make uncertainty explicit instead of relying on a universal buffer, then update the forecast as actual progress and resource availability become known.
Determine metrics and apply them consistently
Decide which metrics you’re going to use and apply the same calculation basis across comparable projects. Benchmark the results against KPIs and historical performance.
Then add the forward signals that can still change the outcome: predicted end date, bonus/penalty exposure, remaining budget, the constrained resource behind the forecast, and the capacity required to intervene.
Read more: 10 PMO KPIs: Essential Metrics to Drive Project Portfolio Performance
Make decisions
Once you have an understanding of project profitability, you have several options:Once you have an understanding of project profitability, you can initiate, renegotiate, postpone, or discard a project.
For active work, add rescue, acceleration, resequencing, continuation, or stop to the decision set.
Read more: How to Make Project Decisions Faster with Epicflow
Add a remaining-investment test
Actual Profit and Predicted Profit answer useful but different questions. Neither tells you whether the remaining investment still deserves the next pound or constrained hour. For continue/stop decisions, exclude sunk cost and compare value still to be earned with the remaining cost and capacity still required.
Illustrative remaining case = Expected value still to be earned − Remaining cost − Opportunity cost of constrained capacity
Actual profitability vs. predicted profitability
Epiflow's Release 93 makes the distinction between the current commercial state and the schedule-linked forward state explicit:
|
Field |
Documented logic |
|---|---|
|
Actual Revenue |
Revenue adjusted for Actual Bonus/Penalty |
|
Actual Profit |
Actual Revenue − Actual Costs |
|
Predicted Revenue |
Revenue adjusted for Predicted Bonus/Penalty |
|
Predicted Profit |
Predicted Revenue − Actual Costs |
Predicted Bonus/Penalty is calculated after a Prediction using the predicted end date versus the baseline and the applied schema. Predicted Profit is therefore a forward sensitivity signal, not a full cost-to-complete forecast, audited forecast margin, or final project profit.
For management purposes, you can interpret the gap between current and predicted profit as profit at risk, but treat that as analyst logic, not the name of a standard Epicflow field.
Portfolio profitability under shared-resource constraints
A project can look profitable in isolation and still reduce total portfolio profitability if it consumes the same scarce specialists needed by other work. The project with the largest revenue or the largest predicted penalty is not automatically the best rescue target.
Net value protected per constrained hour = (Avoidable exposure − Intervention cost − Displaced portfolio impact) / Constrained hours required
This is an illustrative decision metric, not a standard accounting or Epicflow field. Its purpose is to include opportunity cost instead of optimizing one project row in isolation.
Example: protect more value by changing priority
Assume one systems engineer is the bottleneck across two projects and only 40 hours of capacity can be redirected this month.
| Metric | Project A | Project B |
|---|---|---|
| Actual Profit | $310,000 | $160,000 |
| Predicted Profit | $130,000 | $90,000 |
| Predicted exposure / delta | $180,000 | $70,000 |
| Constrained hours needed | 120 h | 16 h |
| Intervention cost | $24,000 | $3,000 |
| Estimated displaced impact | $30,000 | $5,000 |
| Net value protected per constrained hour | $1,050/h | $3,875/h |
Project A shows the larger absolute predicted deterioration, but Project B protects much more value per scarce hour. Project B should be considered first. The remaining 24 hours should not automatically go to Project A: management should retest Project A’s remaining economics and compare resequencing, scope, continuation, or stop.
Best Practices for Project Profitability Management
Here are a few best practices that can help you improve project profitability.
Accurate project assessment
To create an accurate projection of project profitability, project managers need realistic resource requirements. Consult the people who execute the project, analyze historical performance data, consider project novelty, and update estimates as new evidence appears.
Project scope management
An accurately assessed project can still fail to deliver a desired profit margin if its scope increases. For fixed-fee work, scope growth can increase hours and move delivery into a penalty window. Standardize change control and renegotiate commercial terms when the economics no longer hold.
Risk management
Managing project risks ensures your team stays on budget and delivers the project with the expected margin. It’s a complex process that goes beyond profitability assessment, sometimes involving a separate branch of project management. In short, your team needs to:
- Identify potential risks.
- Calculate their probability and impact.
- Create contingency plans for each scenario.
Here are a few examples of contingency plans:
- Subcontractor cannot deliver on their part of the deal: have substitute subcontractors on call.
- Price of supplies increases: procure supplies beforehand.
- Resource requirements assessment is wrong: add a buffer to the estimates.
You might also take overall portfolio risks into account, this will provide more clarity on whether you can accept projects with higher risk at the moment.
Resource optimization
Managing operational risks is one of the major parts of project portfolio management. They occur when projects conflict with one another and lead to resource overload.
In shared-resource portfolios, focus on the bottleneck that actually moves delivery dates. Maximizing utilization everywhere can make queues worse; compare the cost of moving or adding scarce capacity with the net value it can protect across the portfolio.
AI resources are economically relevant only when they relieve a real constraint. If suitable first-pass work can be handled by an AI resource and reviewed by a person, model that resource with capacity and a rate, test whether the predicted delivery date moves, and compare the value protected with the cost. Automating non-constraining work can save hours without improving portfolio profitability.
Performance analysis
Analyzing how well your resources perform and tracking how many hours were spent on the project helps you understand the real costs that went into it. It also allows for more accurate project assessment in the future. If you constantly see that projects take more time than expected, you need to change your approach towards project assessment.
Reviewing workflows
It’s impossible to create a perfectly functioning system on the first try. Even with a calculated and data-backed approach, it will typically take some time to fine-tune a project profitability analysis system you’ve made.
Analyzing the accuracy of your estimates and the relevance of the metrics you use for project profitability analysis is part of the process. Do it regularly and change your processes if needed.
Strategic balancing
The ideal approach to profitability analysis in project management is, as with many other parts of a modern enterprise, a holistic one. You can’t view it as a process separate from the rest of the company.
In a shared-resource portfolio, that also means accounting for displaced capacity: protecting one project’s margin is not a good decision if the same scarce expert creates a larger exposure elsewhere.
Increase Margins Using Project Profitability Software
Let’s take a look at how using a project portfolio management tool, Epicflow, can help your organization achieve better margins.
Resource performance tracking and analytics
Use the Gantt and portfolio views to see project overlap, capacity planning to find resource overload, Historical Load Graph to analyze past and current bottlenecks, and Future Load to see where load is likely to exceed capacity.
Release 93 profitability and contractual exposure
Release 93 adds a configurable financial decision view in Pipeline 2.0. At project level, teams can compare Approved Monetary Budget, Actual Costs, Remaining Budget, Revenue, Actual and Predicted Bonus/Penalty, Actual and Predicted Revenue, and Actual and Predicted Profit alongside schedule and context fields.
The Project Impact Simulator tests how a project’s revenue and projected end-date variance interact with a Bonus/Penalty schema before it is applied. It is a controlled commercial scenario, not a full portfolio resource simulator.
Proactive operational risk management
- Use What-If Analysis to compare alternative project timelines and resource decisions before changing the live plan.
- Use the Epicflow Portfolio Optimizer to compare broader portfolio alternatives against real capacity constraints and value-per-constrained-hour logic. EPO is a broader portfolio capability, not one of the Release 93 financial columns.
Profitability and cash-flow timing answer different questions
Profitability asks how much economic value remains after costs; cash-flow timing asks when value is expected to become invoiceable and when cash is expected under payment terms. Release 93 can connect milestone payments to resource-feasible schedule dates and show Invoice Forecast / Cash Flow timing. Epicflow forecasts expected timing; it does not track bank balances, collection, or confirmed receipts.
Final thoughts
Project profitability analysis is an important part of financial planning and project prioritization.
Use project profit and project margin formulas to establish the baseline, but do not stop at a static number. In resource-constrained portfolios, predicted delivery dates can change contractual exposure and the value of an intervention.
Compare current and predicted commercial states, ignore sunk cost when testing the remaining case, and put the next scarce hour where it protects the most net portfolio value.
Project Profitability Analysis: FAQ's
How do you calculate project profitability?
Calculate project profit as revenue minus the cost basis approved by your organization, then calculate margin as profit divided by revenue × 100. For forward-looking analysis, add predicted delivery dates, bonus/penalty exposure, and a separate remaining-cost estimate; current spend alone is not a final profitability forecast.
What is a good project profit margin?
There is no universal good project margin. The right threshold depends on industry, risk, pricing model, cost allocation, and project type. Compare like-for-like projects using the same cost model, and check whether schedule-linked contractual terms can change the margin before delivery.
What is the difference between project profit and project revenue?
Project revenue is the commercial value earned or expected from the project. Project profit is what remains after subtracting the relevant project costs. High revenue does not guarantee attractive profitability if costs, penalties, or constrained-capacity requirements consume too much of that value.
How often should profitability be reviewed?
Review profitability whenever the forecast materially changes—not only after delivery. Reassess when scope, costs, resource availability, predicted end date, remaining budget, or contractual exposure changes enough to alter the decision.
How to track project profitability?
Track the direct costs that go into the project, compare planned and actual costs, and monitor resource usage in real time so you can intervene if profitability begins to decline.
How can project profitability analysis help in decision making?
For commercially comparable projects, profitability analytics can support prioritization. In constrained portfolios, add the capacity question: how much net value can the intervention protect per scarce hour after accounting for its impact on other projects?
How to calculate the project gross profit?
To calculate project gross profit, you need to calculate project revenue, project cost, and subtract one from another.