Multi-Project Gantt Chart: How to Expose Cross-Project Dependencies and Capacity Conflicts
 Mykhailo Kulakov
.
Updated
.
Project Portfolio Management
.
26 mins READ
Mykhailo Kulakov
.
Updated
.
Project Portfolio Management
.
26 mins READ
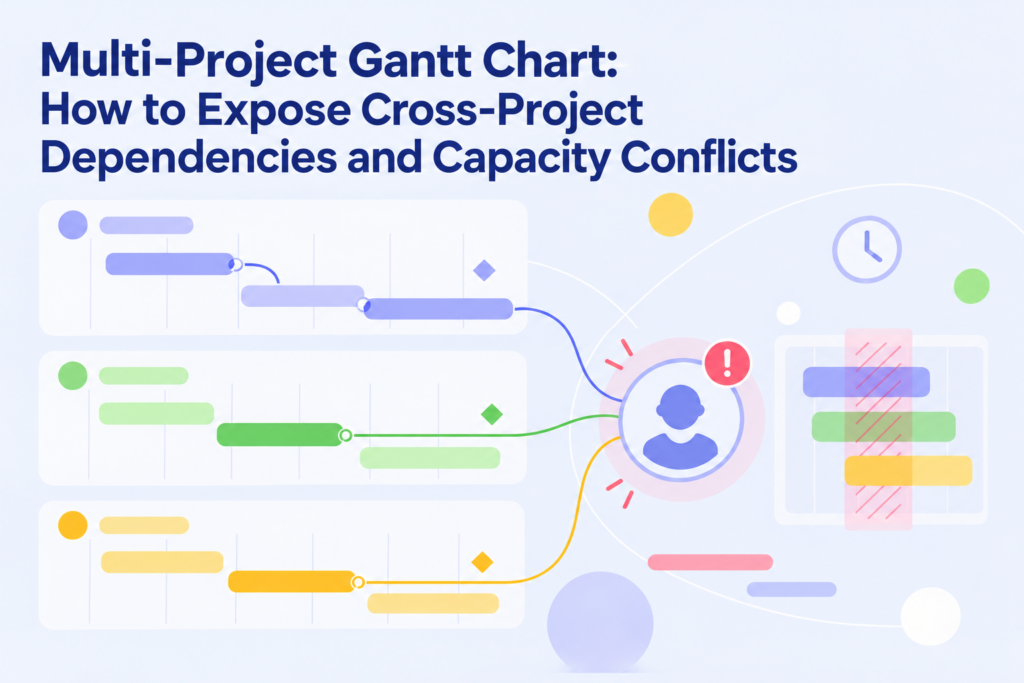
Imagine the situation: you have three projects that are looking suspiciously perfectly green on paper, but still, somehow, form an impossible portfolio. All three projects are on schedule. Still, all of them require the same specialist who can’t be present everywhere simultaneously during overlapping weeks. Moreover, one project depends directly on a milestone from another.
To solve this problem before its impact affects the entire portfolio, companies use a multi-project Gantt chart. It combines the phases, milestones, tasks, and dependencies of several projects in a coordinated timeline. Its real value lies in making interactions between projects visible. To judge whether that combined plan is actually feasible, leaders also need resource-capacity and forecast information.
In this article, we’ll find out how exactly a multi-project Gantt chart can reveal how a single shift changes the entire picture of your project portfolio and how not to fall into a missed deadlines trap.
What is a multi-project Gantt chart?
Before looking at complex portfolios, it helps to review what is a Gantt chart in its standard form: a conventional Gantt maps tasks against time. A multi-project Gantt chart adds the relationships that emerge when several schedules interact.
However, when it comes to a multi-project Gantt chart, it focuses on system interactions, exposing shared milestones and cross-project dependencies. Related variants, such as program or portfolio Gantt charts, scale this view further to support higher-level governance across interconnected business goals.
The fundamental value of a multi-project Gantt comes from rendering relationships visible that do not exist within isolated project views.
| Dimension | Single-project Gantt | Multi-project Gantt |
| Scope | One project | Several concurrent projects |
| Main question | Can this project hit its dates? | How do projects interact? |
| Dependencies | Mostly intra-project | Intra- + cross-project |
| Resources | Project-local view | Competition for shared pools |
| Milestones | Project commitments | Portfolio handoffs and commitments |
| Decision level | Project manager | Program / PMO / portfolio |
| Main risk | Local delay | Local delay propagating elsewhere |
To operate effectively, the view must include key project phases, critical handoff milestones, explicit task connections, baseline schedules, and resource assignments. This structural context allows program managers and PMO leaders to observe how shifting a single predecessor task impacts downstream commitments across the entire enterprise.
Read More: PPM Resource Management: Complete Guide to Optimizing Portfolio Resources
When should you use one Gantt chart for multiple projects?
The decision to adopt a multi-project Gantt chart depends primarily on operational complexity rather than an arbitrary project count. Combined timeline visibility becomes essential the moment projects begin competing for shared resources, exchanging dependencies, or shifting priorities dynamically. Choosing the right environment depends on the sophistication and demands of your delivery ecosystem:
| Requirement | Spreadsheet / Excel | Dedicated Gantt chart | Portfolio/resource system |
| Stable dates | Good | Good | Good |
| Cross-project dependencies | Manual | Good | Strong |
| Shared resource capacity | Weak | Varies | Required for feasibility |
| Frequent reprioritisation | Weak | Moderate | Strong |
| Predicted finish | Weak | Varies | Strong |
| Scenario testing | Manual | Varies | Strong |
| Portfolio governance | Weak | Moderate | Strong |
| Continuous updates | Fragile | Better | Best suited |
Spreadsheets like Excel may remain adequate for a small, relatively static portfolio with fixed milestones and independent teams. However, manual tools break down under frequent updates or shared resource bottlenecks. Excel stops being sufficient the moment the core management question shifts to "What happens elsewhere if I move this date?" When capacity limits dictate delivery feasibility, dedicated portfolio and resource platforms become necessary.
Read More: Multi-Resource Scheduling: Strategies, Examples & Software
How to build a multi-project Gantt chart?
Knowing how to make a Gantt chart for a single project is straightforward, but scaling that process across a portfolio requires structural discipline. Without clear rules, multi-project views quickly descend into a cluttered mess. Follow these eight steps to build a dedicated project management Gantt chart:
Step 1. Decide what decisions the Gantt chart must support.
Do not begin by importing every task from every project schedule. First, clarify how to use a Gantt chart for project management across your specific portfolio by determining the primary decision the chart must serve: executive sequence, phase commitment, dependency review, resource conflict identification, or delivery forecasting. The target decision dictates the required level of detail, preventing clutter before construction begins.
Step 2. Build a consistent hierarchy.
Structure the portfolio using a standardized hierarchy: Portfolio → Project → Phase → Summary → Task → Milestone. Rollup behaviors must work predictably up this chain, consolidating underlying schedules into meaningful high-level progress indicators. You must treat hierarchy as a scalability mechanism. Further, it’ll allow leaders to collapse complexity and expand specific operational paths when investigating issues.
Step 3. Decide which milestones deserve portfolio visibility.
Avoid cluttering the Gantt chart with every internal team checkpoint. Limit portfolio-level visibility to critical inflection points:
- External contractual commitments and customer approval gates.
- Inter-project handoffs and phase exit boundaries.
- Major dependencies that unlock subsequent projects or work packages.
Step 4. Normalize date semantics.
To prevent misinterpretation, establish distinct meanings for each date field displayed across multiple projects:
- Baseline date: The original benchmark commitment.
- Current committed/due date: The agreed-upon target date.
- Predicted finish: the current forecasted completion date based on the planning/prediction model.
- Constraint date: External boundary limits (e.g., regulatory deadlines, fixed supplier drop-dates).
Each date type addresses a different project management question, forcing teams to address risks more proactively.
Step 5. Map cross-project dependencies.
Establish explicit links between projects using task-to-task, milestone-to-task, or milestone-to-milestone relationships. For every major cross-project link, evaluate four questions:
- What work is waiting?
- What must finish first?
- Who owns the handoff?
- What downstream work shifts if the predecessor slips?
Step 6. Add resource and ownership context.
Here, a common pitfall is confusing resource allocation with true delivery capability. Remember that assigning a named owner or role to a bar does not prove operational feasibility. Always maintain the distinction that assignment ≠ availability ≠ capacity. A named resource assigned to three parallel tasks remains constrained by their finite weekly capacity.
Step 7. Preserve baseline, commitment, and forecast.
Keep historical context, agreed targets, and real-time projections visible concurrently.
Illustrative example (not customer data): A project phase shows a Baseline Finish of 15 October, a Current Due Date of 18 October, and a Predicted Finish of 24 October.
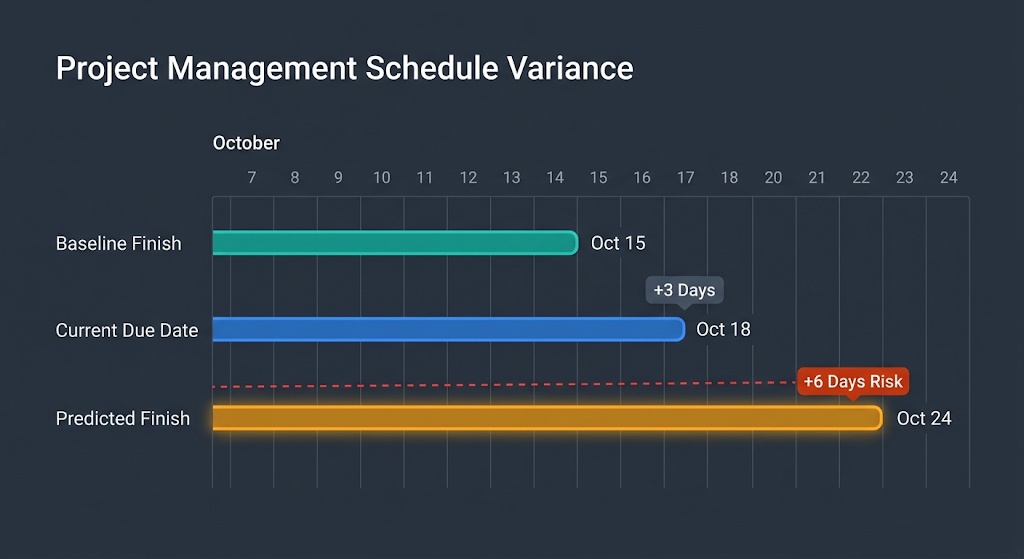
This variance immediately alerts leadership that while the committed deadline has slipped by three days. Meanwhile, the current forecast is six days later than the committed due date, signalling a need for investigation or intervention.
Step 8. Design filters and review cadence.
Maintain Gantt chart readability using targeted filters, such as hierarchy level, phase, milestone, parent-path, date horizon, and role-specific views. At the same time, exclude archived work. Establish a routine cadence for portfolio reviews focused on five core diagnostic questions:
- What changed since the last review?
- Which cross-project dependencies moved?
- Where did shared-resource demand shift?
- Which predicted milestones are now at risk?
- Who owns the necessary intervention?
Read More: PPM Tool Requirements: The Complete Guide to Selecting the Right Project Portfolio Management Tool
Worked project Gantt chart example: three projects, one constrained specialist
To see how local decisions propagate across a portfolio, consider that an organization running three strategic initiatives managed by a shared PMO:
| Element | Illustrative setup |
| Project Atlas | Customer platform migration |
| Project Beacon | Integration programme |
| Project Crest | Compliance upgrade |
| Shared specialist | One systems architect; 40 hours/week available |
| Atlas demand | 24 hours |
| Beacon demand | 20 hours |
| Crest demand | 16 hours |
| Total demand | 60 hours against 40 hours of capacity |
The system dynamics and initial friction
Two critical relationships connect these independent initiatives:
- Cross-project dependency: Project Atlas must complete its interface-architecture milestone before Project Beacon can begin integration testing.
- Resource competition: Project Crest is structurally independent, but relies on the same systems architect to complete its regulatory review.
Even before schedule variance occurs, total architect demand (60 hours) exceeds available weekly capacity (40 hours).
The local change and portfolio propagation
During execution, the interface-architecture task in Project Atlas expands due to unexpected technical scope, growing from five working days to eight.
Because the portfolio operates as an interconnected system, this local three-day delay triggers an immediate chain reaction:
Atlas Task (+3 Days) → Atlas Phase Boundary Moves → Beacon Integration Start Shifts → Architect Demand Concentrates into Crest Review Window → Predicted Portfolio Commitments Slip
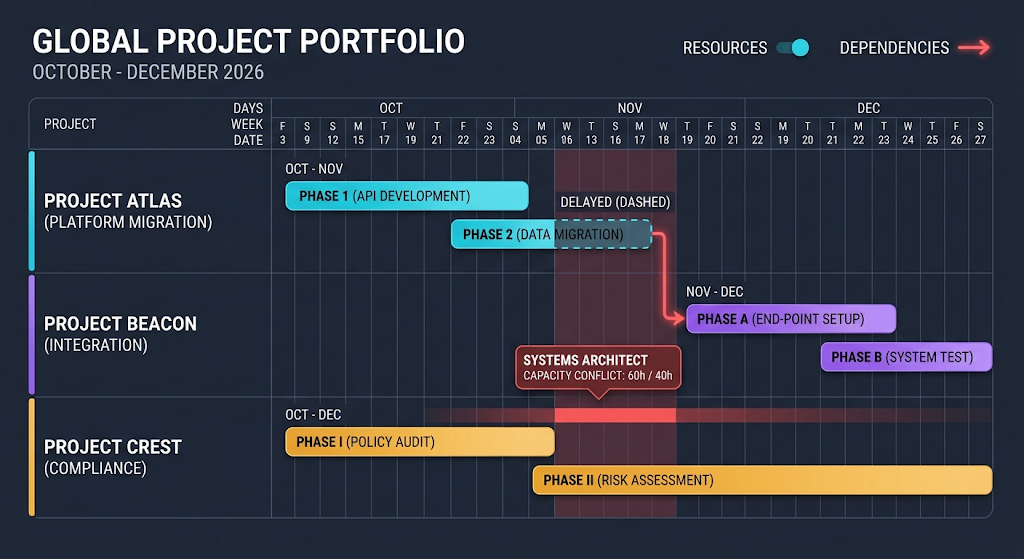
Because Project Beacon’s start date is forced outward, the architect's required effort shifts directly into the review window previously reserved for Project Crest. Under this scenario, we assume that all three project assignments now require the architect within the exact same five-day window, no other qualified architect is available, and neither Beacon nor Crest has schedule float remaining before their committed milestones. Under these conditions, fitting 60 hours of total demand into a 40-hour capacity limit logically forces a downstream trade-off: without intervention, at least one delivery milestone will miss its committed due date.
Portfolio interventions
When this Gantt chart example exposes causal propagation across the three initiatives, leadership can evaluate four distinct management decisions:
- Reallocate qualified capacity: Assign a secondary, appropriately qualified architect to absorb Atlas’s remaining tasks.
- Stagger delivery timelines: Intentionally delay or pause lower-priority tasks within Project Crest to free immediate capacity.
- Adjust sequence logic: Re-sequence non-critical integration steps in Project Beacon to protect the higher-priority compliance commitment.
- Run what-if scenario analysis: Test alternative timeline adjustments in a sandbox environment to evaluate capacity feasibility before altering live project baselines.
There is no universally correct choice. The optimal intervention depends on business priorities, available skill sets, and downstream impacts. If Beacon has a late-delivery penalty or milestone-linked revenue, the forecast movement may also create a commercial consequence.
Read More: How to Implement Project Portfolio Management (PPM): Steps, Challenges, and Costs Explained
How to keep a multi-project Gantt chart readable as the portfolio grows
As portfolios expand, Gantt charts often collapse under their own visual weight. The scalability problem is not too many projects; it is showing every project within the Gantt chart timeline at the wrong level of detail simultaneously. Maintaining readability requires active visual governance and progressive disclosure mechanisms that keep data actionable.
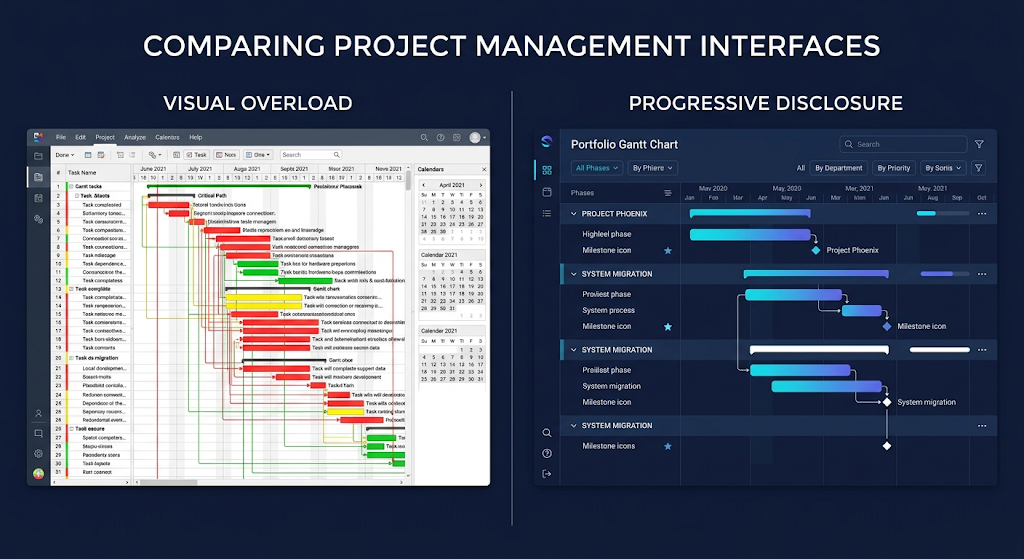
Implement these nine core practices to preserve clarity across large project portfolios:
- Collapse and expand hierarchy: Keep high-level views folded, allowing users to drill down into specific sub-tasks only during deep-dive investigations.
- Phase rollups: Summarize detailed underlying work streams into clean, high-level phase bars for executive reviews.
- Progressive disclosure: Expose granular scheduling data conditionally based on user focus.
- Targeted filters: Isolate specific projects, teams, tags, or risk areas to eliminate irrelevant background noise.
- Flexible date horizons: Switch between long-range annual planning perspectives and near-term operational windows.
- Role-specific views: Tailor visibility to the user (executives view strategic milestones, while delivery leads see active task handoffs).
- Limited milestone density: Restrict portfolio-level markers to major contract gates and critical handoffs.
- Archival discipline: Regularly archive or hide completed initiatives to keep current operational views clutter-free.
- Restrained color use: Reserve high-contrast accent colors exclusively for active bottlenecks, critical path links, and schedule variances.
Read More: Value-Based Portfolio Management Explained: How to Maximize Business Value with Available Resources
What a Gantt chart cannot tell you by itself
A multi-project Gantt chart excels at exposing timing and structural relationships. However, relying on timeline bars alone creates dangerous operational blind spots. As established in project portfolio management standards (such as PMI's PMBOK® Guide and DCMA scheduling frameworks) [1][2], visual schedule networks reflect sequence logic but do not inherently prove resource feasibility or statistical confidence. A Gantt chart in project management provides the structural relationships from which leaders investigate causality; it does not automatically prove causality or optimize the portfolio.
To bridge this gap, modern portfolio environments connect timeline views directly with active capacity models and predictive forecasting. For example, current Epicflow product capabilities allow planners to inspect calculated possible dates, evaluate shared bottleneck capacity, and test what-if staggering scenarios before altering live project baselines.
To avoid flawed scheduling assumptions, PMO and delivery leaders must recognize five critical blind spots where Gantt charts fall short without supplementary resource and management context:
| Blind spot | What the timeline bar hides |
| Capacity feasibility | Overlapping bars show timing alignment. They do not prove that sufficient qualified human capacity exists to execute the work simultaneously. |
| Priority decisions | Gantt charts can reveal resource competition between projects, but it cannot independently decide which initiative deserves the scarce specialist. |
| Forecast probability | The planned bar represents an intended target date. It is not automatically the statistically predicted outcome or realistic completion date. |
| Commercial consequences | A shifted schedule bar indicates time variance, but it does not inherently display downstream financial exposure, contractual penalties, delayed revenue, or expected cash-flow impact. |
| Data quality & integrity | Incorrect cross-project dependencies or stale progress updates will render the visual timeline deceptively optimistic, leading to false conclusions. |
To establish operational feasibility, leaders must connect the timeline relationships shown on a Gantt chart with live capacity demand and strategic priority frameworks.
Read More: Portfolio Resource Management: A Complete Guide
How Epicflow connects Gantt chart views with capacity and prediction
Epicflow addresses the inherent limits of visual timelines by linking the multi-project Gantt chart directly to resource feasibility and predictive modeling. The platform integrates timeline relationships with active capacity analysis to help leaders make informed portfolio decisions.
Narrow the causal slice.
Large portfolios create visual clutter. Epicflow allows users to isolate specific scheduling relationships using hierarchy controls, phase rollups, milestone filters, and Parent Path navigation. This filtering enables managers to focus on the exact chain of tasks driving a downstream commitment without losing overall structural context.
Inspect underlying date logic.
To understand why dates sit where they do on the timeline, leaders can inspect the underlying drivers. Epicflow exposes task durations, predecessor connections, manual dates, constraint dates, and calculated possible dates in its Gantt chart tool. Separating external boundary constraints from ordinary plan movement clarifies whether a schedule delay is flexible or hard-constrained.
Investigate shared-resource consequences.
A Gantt chart tool’s timeline bar shows when work is scheduled, but connecting it with Epicflow’s bottleneck and capacity context reveals whether the plan is operationally feasible. Planners can connect schedule changes with Epicflow's capacity and bottleneck context to evaluate how a phase shift may affect shared-resource demand elsewhere in the portfolio.
Apply business priority context.
When multiple initiatives compete for finite specialist availability, Epicflow’s Business Value adds decision context when projects compete for constrained capacity, helping leaders compare trade-offs alongside dependencies, commitments, and feasibility.
Test alternatives with what-if scenario analysis.
Rather than relying on the Gantt chart to automatically choose solutions, planners use what-if scenario planning and project staggering tools. Teams can simulate resource reallocations or schedule adjustments in a sandbox environment to verify capacity feasibility before committing changes to live project baselines.
Explore how Epicflow combines multi-project Gantt chart views with resource-capacity forecasts, prediction, and portfolio scenario analysis.
Read More: Enterprise Project Portfolio Management Explained: Key Components, Process & Best Practices
Conclusion
Putting several project schedules onto a single screen does not automatically create a feasible portfolio. The true value of a multi-project Gantt chart lies in understanding what moves elsewhere in the system when a single local schedule changes.
To turn a complex timeline into an actionable causal map, PMO leaders need four interconnected layers of operational context:
- Dependency context: Reveals how local task delays propagate across shared milestones and inter-project handoffs.
- Capacity context: Verifies whether overlapping work streams are actually feasible given finite specialist availability.
- Forecast context: Distinguishes committed targets from statistically predicted delivery dates.
- Priority and scenario context: Helps leadership evaluate trade-offs and test interventions in a sandbox before changing live plans.
References
- Project Management Institute. (2021). A guide to the project management body of knowledge (PMBOK guide)—seventh edition and the standard for project management.
- DMCA 14 Schedule assessment.
FAQs
Can you use a Gantt chart for multiple projects?
Yes, a single Gantt chart can coordinate multiple concurrent projects. However, while a combined timeline clarifies scheduling interactions and handoffs across initiatives, it cannot guarantee project feasibility on its own without connected resource-capacity and workload forecast data.
How to create a Gantt chart for multiple projects in Excel?
You can build a multi-project Gantt chart in Excel by grouping tasks under project headers, using stacked bar chart types or conditional formatting rules, and adding custom date columns. Keep in mind that manual spreadsheets are functional only for small, static schedules. However, they quickly become fragile under frequent updates and fail to track shared resource capacity limits effectively.
What should a multi-project Gantt chart include?
A robust multi-project Gantt chart must include project groupings, phase structures, major handoff milestones, task dependencies, named owners, resource context, baseline dates, predicted finish dates, and targeted view filters. These elements make project portfolio timelines actionable and allow companies to evaluate schedule changes and downstream delivery risks.
How do you show cross-project dependencies in a Gantt chart?
Cross-project dependencies in a multi-project Gantt chart are displayed through visible linking lines or explicit predecessor connectors between tasks or handoff milestones across different project streams. Assigning clear ownership to every handoff ensures that when an upstream task shifts, managers can immediately trace which downstream project is impacted and who owns the necessary intervention.
What is the difference between a program Gantt chart and a project Gantt chart?
A project Gantt chart focuses on executing tasks within a single project.
A program or portfolio Gantt chart aggregates multiple interconnected initiatives into a single high-level operational view. Program Gantts support PMO governance by highlighting cross-project dependencies, shared resource contention, phase rollups, and broader strategic delivery milestones.
Can a Gantt chart identify resource conflicts?
A standard Gantt chart can show timeline overlaps where tasks coincide, but it cannot independently identify true resource bottlenecks or capacity shortages. Reliable resource conflict detection requires connecting time-phased schedule data directly with real-time resource demand and individual or team capacity availability.