Project Cost Management: Process, Methods, and Portfolio Control
 Mykhailo Kulakov
.
Published
.
Project Management
.
42 mins READ
Mykhailo Kulakov
.
Published
.
Project Management
.
42 mins READ

Project cost management (PCM) is the discipline of planning how costs are governed, estimating required resources and money, approving and time-phasing a budget, measuring actual cost and progress, forecasting the outcome, and controlling change. In multi-project portfolios, credible cost forecasts also require feasible schedules and shared-resource capacity. [1] [4]
A project can remain inside its monetary budget while a shared engineering bottleneck already puts its completion date and contractual outcome at risk. This guide explains the process, methods, metrics, and interventions that project management office (PMO) leaders and finance partners can use before that exposure becomes a loss.
Key takeaways:
- A cost estimate, an approved monetary budget, and a cost baseline serve different purposes.
- Financial forecasts depend on scope, schedule, resource feasibility, and clearly stated assumptions.
- Shared-resource bottlenecks can create commercial exposure before actual spending exceeds the budget.
- Early intervention should protect constrained capacity, not simply reduce whichever cost line is easiest to cut.
- Project portfolio management (PPM) and enterprise resource planning (ERP)/accounting systems serve complementary roles; define data ownership and reconciliation.
What is Project Cost Management?
Project cost management connects scope, schedule, resources, and risk with financial decisions throughout the project’s lifecycle. This practice involves estimating the resources required, setting an approved budget and cost baseline, measuring actual cost and earned progress, and updating the expected outcome as conditions change.
This discipline is broader than simple cost cutting or accounting: it includes risk assessment, forecasting, and governed changes to the plan. AACE International’s Total Cost Management framework similarly connects estimating, planning, scheduling, and cost control across the lifecycle. [4]
Before costs can be assessed, management needs to define project scope, create a work breakdown structure (WBS), build a schedule around contractual commitments, and analyze resource availability and risks. Change control then governs approved changes to scope, schedule, and budget throughout delivery. [2]
Cost estimate, budget, baseline, and forecast
| Term | Meaning | Not the same as |
|---|---|---|
| Cost estimate | Expected cost based on scope, resources, rates, and assumptions. | An approved spending limit. |
| Approved monetary budget | Authorized project funding expressed in currency. | Automatically a time-phased baseline. |
| Cost baseline | Time-phased approved budget used to measure cost performance. | Actual spending or final-cost forecast. |
| Work-Hour Budget | Planned labor effort expressed in hours. | A monetary budget. |
| Actual cost | Cost incurred for work performed. | A forecast of remaining or final cost. |
| Estimate at Completion (EAC) | Expected total cost under stated assumptions. | Remaining budget or available funding. |
What are the types of project cost?
Project costs can be classified by attribution, behavior, and recoverability. These labels overlap rather than forming five mutually exclusive categories: [1] [2]
- Direct cost. Costs attributable to executing the project, like project-team labor.
- Indirect cost. Costs incurred by the company as a whole, for instance administrative costs.
- Fixed cost. Costs that do not change with work volume within the relevant range, for instance a fixed setup fee.
- Variable cost. Costs that change with the volume of work or resources used.
- Sunk cost. Costs already incurred that cannot be recovered.
Why Project Cost Management Matters
Project cost management supports realistic funding, financial accountability, early warning, and corrective action. Its value is not limited to explaining a budget variance: it gives project and portfolio leaders a way to test whether the assumptions behind the financial plan still hold. [2]
- Early variance detection. PCM practices help teams monitor cost variance at each review and take measures to prevent further issues.
- Forecast quality improvement. Comparing estimates with actual results can improve future assumptions when the historical data is relevant and comparable.
- Change governance. PCM defines who can approve budget changes and how those decisions are recorded.
- Financial accountability. A project cost management framework helps managers track where spending differs from projections and assign corrective action.
- Realistic funding. With all of the data above, companies can improve their financial planning ability and create more realistic budgets.
- Better decision making. Overall, adopting PCM allows organizations to make better, data-informed decisions in the area of finances.
Why portfolios make PCM harder
Managing costs of each individual project is hard enough, but a multi-project environment makes implementing cost management even more difficult.
Here are a few core reasons for that:
- Shared specialist pools. In multi-project environments, resources are often shared between projects, especially highly skilled resources.
- Project interdependencies. Projects can depend on each other through shared resources or because one deliverable must be finished before another can start.
- Priority changes. There are few industries where priorities stay the same. Either due to market forces or supply chain disruptions, project priority can change, and continuing with the old plan might mean financial losses.
These three factors can turn a delay in one project into a portfolio-wide problem. Spending reports alone do not show whether the remaining work is feasible within shared capacity.
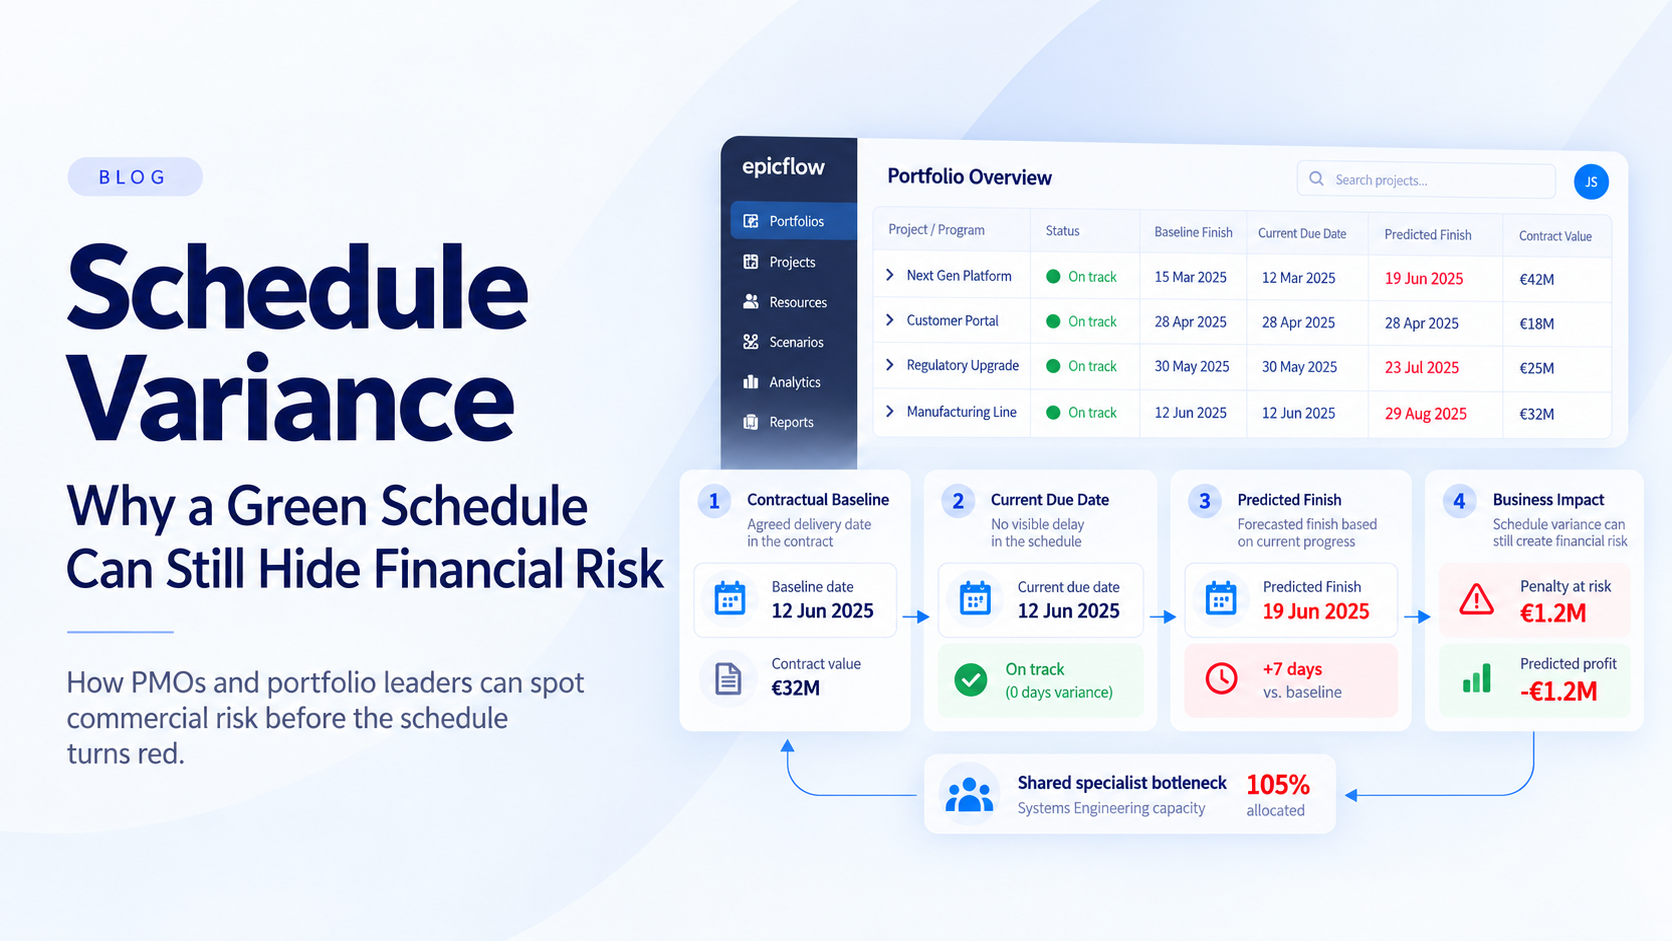
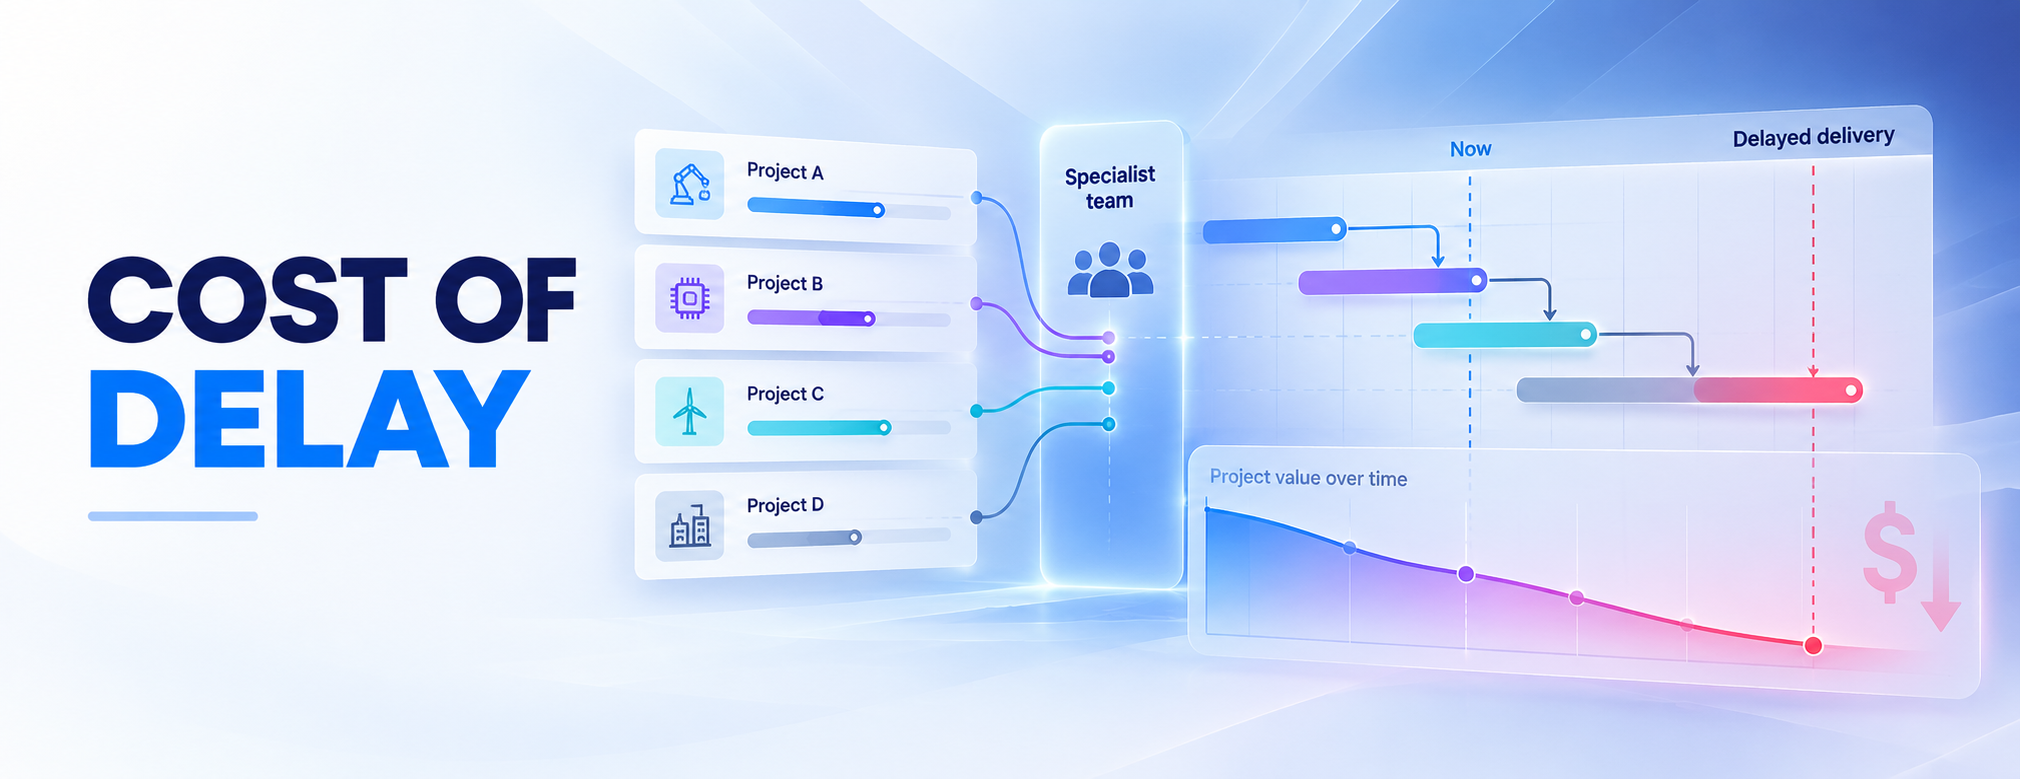
Consider Project A in the engineering example below. Actual spending remains below its approved monetary budget, but a queue for systems engineers pushes its predicted completion beyond the contractual penalty threshold. Waiting for an overrun would miss the earlier warning: the delivery forecast already shows value at risk.
Resource capacity planning tests that delivery feasibility across projects, rather than assuming that each approved plan has exclusive access to the same specialists.
Four Core Processes of Project Cost Management
The four core process areas used here are plan cost management, estimate costs, determine the budget, and control costs. They provide the structure; the seven operational steps below separate risk assessment, measurement, forecasting, and intervention so ownership and decisions are clearer. [1]
| Core process | Operational steps | Main inputs and outputs | Review owner |
|---|---|---|---|
| Plan cost management | 1. Plan the approach | Governance needs → cost-management rules. | Project manager / finance partner |
| Estimate costs | 2. Estimate; 3. Quantify uncertainty | Scope, rates, data, risks → supported estimates and ranges. | Project manager / resource manager |
| Determine the budget | 4. Approve and baseline | Estimates and risk treatment → monetary authorization and baseline. | Sponsor / finance partner |
| Control costs | 5. Measure; 6. Forecast; 7. Intervene | Actuals, progress, forecasts → approved action and updated outlook. | Project manager / PMO |
Seven Operational Steps of Project Cost Management
Execute project cost management in seven steps: plan the approach, estimate costs, quantify uncertainty, approve and baseline the budget, measure actual cost and earned progress, analyze variance and forecast, then control change and intervene. This is a practical operating translation, not an official Project Management Institute (PMI) seven-step list. Repeat measurement, forecasting, and intervention as progress, capacity, risk, or scope changes.
Plan the cost-management approach
The first step is organizing the process. Define roles and responsibilities, units of measurement, data sources, reporting cadence, escalation thresholds, approval workflows, and change control rules.
Standardizing these controls can reduce decision delays and the idle time they create during execution.
Estimate costs
With that structure in place, start by estimating the costs of the project. Use the work breakdown structure and calculate the cost of labor, materials, and prices charged by your vendors. Use relevant historical data to support assumptions, then update them as actual evidence arrives. [2]
Compare project cost estimation methods according to scope maturity, available data, and uncertainty.
Estimate labor effort in hours, apply cost rates, and check when the required skills are available. Cost is not customer price, and estimated hours do not establish a feasible schedule.
Quantify uncertainty
The next step is quantifying and managing the uncertainty in the project. It starts with investigating the project pipeline and identifying areas that might be disrupted, whether due to scheduling errors, changes in resource availability, or supply chain issues.
Assess probability, impact, and sensitivity to assumptions such as specialist availability or supplier lead time. Use ranges and risk analysis to support contingency, and define who can authorize reserve use. A reserve does not remove the underlying delivery risk. [2]
Read more: Project Risk Management: Importance, Challenging Issues, Recommendations
Approve the budget
The next step is to form and approve the monetary budget for the project and establish a time-phased cost baseline. Keep the Work-Hour Budget separate. Under the process framework used here, contingency for identified risks is included in the baseline; management reserve is controlled outside it. [1]
Track actual costs and earned progress
During execution, track incurred labor and other project costs alongside completed work. Reconcile actuals with the agreed financial data source, and distinguish outstanding commitments from costs already incurred. Measuring spend without earned progress can conceal work that is simply not advancing. [2] [3]
Track predicted contractual bonus or penalty exposure separately from actual spending. Referenced in the example below, Project A’s budget can still have room while its forecast completion date has already crossed a penalty threshold.
Analyze variance and update forecasts
At each review, compare actual costs and earned progress with the baseline, then check predicted dates against commitments. Investigate both current variance and adverse forecast changes, even when spending remains below the approved monetary budget.
Identify the responsible dependency, resource group, scope change, or estimating assumption. Update the Estimate at Completion (EAC), Estimate to Complete (ETC), and Variance at Completion (VAC), stating the assumptions behind the selected forecast method. [2] [3]
Control changes and intervene
Compare corrective options before committing: reallocate capacity, resequence work, or evaluate an approved scope change. In Project A’s case, test whether moving another work package protects its completion without creating greater losses elsewhere. Update forecasts after the decision. A revised forecast does not itself authorize a budget or baseline change.
Here is a quick action guide on the process:
Plan → Estimate → Risk-test → Budget/Baseline → Measure → Forecast → Control
Control loops back to measurement and forecasting; budget or baseline changes require authorization.
Project Cost Estimation Methods And Budgeting Techniques
No estimating method is universally the most accurate. Choose techniques according to scope maturity, data quality, uncertainty, and the decision being made. Cost estimation in project management can combine several methods; project costing still depends on documenting and updating the assumptions behind the numbers. [1] [2]
| Method | Best use and data needed | Strength | Limitation |
|---|---|---|---|
| Analogous | Early estimates; comparable historical costs, current scope, and expert judgment. | Fast and inexpensive. | Differences in scope or conditions require justified adjustments. |
| Parametric | Unit-scalable work; quantities and validated historical cost relationships. | Consistent scaling of cost drivers. | Depends on model validity; relationships are not necessarily linear. |
| Bottom-up | Detailed planning; WBS, activity estimates, resource requirements, and rates. | Makes work-package assumptions visible. | Time-consuming; incomplete scope or duplicated allowances distort the total. |
| Three-point | Uncertain work; optimistic, most likely, and pessimistic estimates. | Makes uncertainty explicit. | Results depend on judgment and the chosen weighting method. |
| Reserve analysis | Risk treatment; documented risks, probability, impact, and response costs. | Supports evidence-based contingency. | Requires approval rules; reserves do not guarantee protection from overruns. |
| Vendor bid analysis | Outsourced work or procurement; comparable quotes and scope. | Uses current supplier offers. | Exclusions, validity periods, and differing assumptions require reconciliation. |
Next steps in the cost estimation process
Several techniques can be applied to one project. Estimates become an approved budget only after aggregation, risk treatment, review, and authorization. Refine scope and assumptions as evidence improves; vendor prices, resource rates, and delivery conditions should not be treated as permanently fixed.
Metrics and Formulas for Project Cost Control
Project cost control combines actual cost, earned progress, variance, and forecast metrics. Earned Value Management (EVM) measures completed work in budget terms, not customer revenue. Interpret each forecast using its stated assumptions and the same reporting date, scope, and cost basis. [3]
| Metric | Definition or formula | Interpretation / limitation |
|---|---|---|
| Budget at Completion (BAC) | Total budget for the authorized work measured by EVM. | Reference for the final-cost forecast; not contract revenue. |
| Planned Value (PV) | Budgeted value of work scheduled by the status date. | The plan, not actual spending. |
| Earned Value (EV) | Budgeted value of work actually completed. | Progress expressed in budget terms, not business value. |
| Actual Cost (AC) | Cost incurred for the work performed. | Use a consistent reporting date and scope. |
| Cost Variance (CV) | CV = EV - AC | Negative: unfavorable cost variance. Positive: favorable variance. |
| Cost Performance Index (CPI) | CPI = EV / AC | Below 1: unfavorable; 1: on-cost; above 1: favorable cost efficiency. Requires nonzero AC; not a profit measure. |
| Estimate at Completion (EAC) | One method: EAC = BAC / CPI | Use only when current cost efficiency is expected to continue; requires positive CPI. |
| Estimate to Complete (ETC) | ETC = EAC - AC | Expected cost of remaining work under the selected forecast. |
| Variance at Completion (VAC) | VAC = BAC - EAC | Negative: forecast overrun against BAC. |
| Remaining budget | Amount left under the defined budget-consumption rule. | Not automatically ETC or a forecast of final cost. |
| Contingency use | Amount and pace of contingency consumption. | Review against remaining risk, not just reserve balance. |
| Forecast confidence | Confidence in the estimated outcome or range. | Depends on data quality, uncertainty, and assumptions. |
Alternative EAC methods use a revised remaining-work estimate or different performance assumptions. A CPI below 1 indicates that completed work cost more than its budgeted value; it does not, by itself, show that the contract or company is unprofitable. [3]
Portfolio leaders also need resource overload, predicted completion dates, and contractual exposure signals. These identify risks that a cost-efficiency ratio cannot locate: Project A’s next scarce engineering hour may protect a commitment even before a spending variance appears.
Read more: Earned Value Management (EVM): Key Metrics, Benefits, and How to Calculate It
How Schedule and Resource Risk Affect Project Cost
A resource bottleneck affects project cost when it delays dependent work, creates additional effort, or triggers a contractual condition. In a shared-resource portfolio, the same queue can also postpone value on other projects. Not every delay creates a new expense, so identify the mechanism rather than labeling every effect an overrun.
Shared engineering constraint → queue, rework, or rescheduling → delivery-date movement
| Potential spending effects | Commercial exposure and displaced value |
|---|---|
| Recovery work, expediting, standby, or time-dependent overhead may add cost. | A penalty, lost bonus, or delayed work on another project may erode portfolio value. |
| Record costs when incurred under the agreed cost rules. | Assess potential value loss separately; do not add the same consequence twice. |
Intervention loop: investigate the constraint → compare feasible changes → authorize action → reforecast.
Not intervening at the right time can lead to:
- Contractual exposure. A later finish may lose a bonus or trigger a penalty under the agreed rules.
- Recovery spending. Overtime, expediting, or additional contractors can add costs when management accelerates delayed work.
- Waiting. Dependent teams may be idle; a financial cost arises when, for example, a standby charge applies.
- Accrued time-dependent overhead costs.
Rework has two consequences at a bottleneck: it consumes effort and occupies capacity another project needs. Even when there is no additional payment, that displaced work can delay a valuable commitment. Keep recorded costs, recovery spending, and delayed or lost value distinct; do not count one consequence twice.
That’s why resource management is an important part of PCM in engineering-intensive portfolios. Managers need to identify the capacity that limits completion, not assume that higher utilization everywhere will improve the portfolio’s financial result.
Intervene where a capacity or sequence change improves throughput at the constraint. A cheaper task on a non-constraint may reduce a visible cost line without advancing completion. Compare the value protected with the intervention cost and any value displaced on other projects.
Using capacity planning software helps managers see peak demand against available capacity. Combine that view with delivery forecasting and what-if analysis to test whether an intervention changes the dates that drive commercial exposure.
Worked Example: a Shared Engineering Bottleneck Across Three Projects
In this illustrative engineering portfolio, 320 hours of demand compete for 256 available hours in a critical two-week window. Moving 64 hours of flexible work can protect time-sensitive commitments while Project A remains within its monetary budget, provided later capacity and dependencies permit the shift. The figures are illustrative, not a customer result.
Four systems engineers provide 128 productive project hours per week. Three concurrent projects, A, B, and C, require 320 hours in weeks 2 and 3, against 256 available hours: 320 - 256 = 64 hours of overload.
Lower demand in weeks 1 and 4 can hide the issue in a monthly capacity total. The overload signals an infeasible peak, not proof that every project must be late; the schedule and dependencies determine which commitments are exposed.
At the end-of-week-2 review, Project A’s actual costs are still below its approved monetary budget. Under the unchanged priorities below, its resource-aware forecast puts the completion milestone beyond the contractual grace period.
| Project | Context | Critical-window demand | Illustrative exposure |
|---|---|---|---|
| Project A | Time-sensitive completion milestone. | 160 specialist hours in weeks 2-3. | $40,000 contractual penalty if completion is after week 3, including its grace period. |
| Project B | Flexible work package; lower immediate commercial exposure. | 96 specialist hours in weeks 2-3. | $5,000 standby only if the contractor’s week-4 start moves to week 5. |
| Project C | Completion bonus tied to week 4. | 64 specialist hours in weeks 2-3. | $25,000 bonus at risk if validation finishes after week 4. |
| Portfolio total | Critical window. | 320 hours demand vs 256 hours capacity. | $65,000 exposure under unchanged priorities; $5,000 standby only in the alternative. |
Scenario assumptions: the four engineers are qualified for these work packages, which become ready in week 2 and can be divided among them. Week 2 completes 64 hours for A, 32 for B, and 32 for C. A must finish by the end of week 3, including its grace period. C needs engineering completed by then to enter one full week of validation in week 4 and earn its bonus. B’s contractor is booked for week 4 and cannot be redeployed; a one-week postponement incurs $5,000 in standby.
| Scenario | Capacity and decision | Illustrative commercial effect |
|---|---|---|
| Unchanged priorities | Week 3: B uses 64 hours and A uses 64; C gets none. A and C each carry 32 unfinished hours into week 4. B’s contractor starts on time. | A finishes after its grace period; C’s validation moves to week 5. $40,000 penalty + $25,000 lost bonus = $65,000 exposure. No B standby. |
| Alternative sequence | Week 3: A uses 96 hours and C uses 32, totaling 128. Defer B’s remaining 64 hours to week 4; its contractor starts in week 5. | A finishes in week 3; C completes validation in week 4. Their commitments are protected; B incurs $5,000 standby. |
| Net potential value protected | Compare the two stated scenarios. | $65,000 - $5,000 = $60,000. |
Week 4 has 64 uncommitted engineer hours after other planned demand, enough for either A’s and C’s unfinished work or B’s deferred package. B is not a predecessor of A or C. C’s independent validation team is available in week 4 or 5, and B has enough delivery float to absorb the shift without another contractual loss. Assume unchanged scope, total engineering effort, and cost rates, with no overtime or additional recovery costs. Reforecast all three projects before approving the change; B is not necessarily the lowest-value project overall.
The PMO, resource manager, project managers, and finance partner can therefore act before Project A exhausts its budget. The $60,000 is the net scenario-based commercial value protected after B’s $5,000 standby cost, not booked savings or a guaranteed profit increase. The comparison excludes tax, overhead allocation, probability weighting, and other cost changes.
For the wider financial assessment, see project profitability analysis.
Common Project Cost Management Mistakes and Best Practices
The most damaging project cost management mistakes disconnect the numbers from the work: weak definitions, unsupported assumptions, unrealistic resource plans, and late intervention. A useful control practice specifies what will be measured, who will investigate, and which decision can change the outcome.
| Common PCM mistake | Better practice |
| Confusing estimate, budget, baseline, actual cost, and forecast. | Define each term, unit, source, and decision purpose; keep forecasts separate from approved funding. |
| Treating the baseline as immutable or changing it without governance. | Maintain the approved baseline as the reference. Change it only through authorization and retain its history. |
| Tracking spend without measuring earned progress. | Use EVM where appropriate to compare actual cost with budgeted value of completed work. |
| Using one EAC formula without stating assumptions. | Select the EAC method according to remaining-work and performance assumptions; document the choice. |
| Ignoring commitments, risk, and forecast confidence. | Review commitments separately from actuals, reassess remaining risk, and update forecast confidence. |
| Ignoring cross-project resource feasibility. | Test competing demand in critical time windows; identify which shared resource limits completion. |
| Using PPM and ERP data without defined ownership and reconciliation. | Assign ownership, reporting dates, integration rules, and reconciliation responsibility. |
| Reacting only after a penalty or margin loss becomes actual. | Investigate predicted date and penalty changes while there is still time to resequence or reallocate work. |
When applying ways to reduce project costs, test whether the saving changes the constraint or merely lowers a local cost line.
What to Look for in Project Cost Management Software
Project cost management tools should complement ERP and accounting systems by connecting financial data with scope, schedule, resources, progress, forecasts, and change decisions. Evaluate which capabilities the project layer owns and which it receives from finance systems; a dashboard alone does not establish a reliable control process.
Use this checklist for a shared-resource portfolio. “Must” identifies required control outcomes; “Useful” identifies context-dependent enhancements. “Depends on ERP” clarifies financial ownership or reconciliation. A required outcome may be native or integrated, but its data source, update rules, and accountable owner must be explicit.
| Capability | Must | Useful | Depends on ERP |
|---|---|---|---|
| Budget and actuals | Monetary authorization, actual cost, remaining budget, and traceable changes. | Configurable portfolio views. | Agreed financial source and reconciliation. |
| Effort | Work-Hour Budget and recorded effort, separate from currency. | Resource-group effort filters. | Rate ownership when finance supplies labor costs. |
| Performance | Baseline, earned progress, variance, and explicit forecast assumptions. | Additional project indicators. | Consistent actuals; name the separate forecasting owner. |
| Delivery | Predicted dates reflecting shared capacity and dependencies. | Comparison of forecast changes. | Delivery forecasts are not recognized revenue. |
| Scenarios | Test sequence or allocation changes across affected projects. | Contractual-impact comparison. | Finance validates economic assumptions. |
| Governance | Permissions, audit history, integration rules, and update ownership. | Custom fields, key performance indicators (KPIs), and filters. | Reconciliation cadence and discrepancy resolution. |
| Contractual exposure | Trace applicable commitments and rules to projects. | Prediction-linked bonus/penalty signals where relevant. | Contract interpretation and recorded financial outcomes. |
| Transactions | Defined exchange of project and finance data. | Additional reporting views. | Accounting, invoicing, payment, and revenue-recognition controls. |
Ask vendors to demonstrate one control loop: reconcile an actual cost, change a shared-resource assumption, compare delivery forecasts, and trace who authorized the response. Record which system owns each step. In particular, do not mistake a remaining-budget field for a final-cost forecast or a predicted penalty for a posted accounting transaction. Use what-if analysis to examine the portfolio effects before committing.
For the product overview, explore Epicflow’s budgeting and cost control and enterprise project portfolio management capabilities. The next section shows how its predictive portfolio layer supports earlier intervention.
How Epicflow Connects Delivery Feasibility to Financial Control
Epicflow connects finite shared capacity and predicted delivery dates with portfolio-level financial signals. For mission-critical, resource-constrained project organizations, the purpose is earlier economic intervention: identify the constraint behind a deteriorating outlook, compare alternatives, and change the plan before the consequence becomes actual.
For Project A, the decision starts with a predicted penalty while Remaining Budget is positive. Use the following workflow.
- Observe the financial signal. In Pipeline 2.0, Approved Budget is editable project-level monetary authorization, distinct from Work-Hour Budget. Actual Cost is read-only: labour costs plus Spent Additional Costs. Remaining Budget is read-only; a negative value marks an over-budget project. A positive balance does not rule out commercial exposure.
- Investigate the constraint. Use resource-aware predictions and cross-project context to find the limiting specialist group. Pipeline filters for phases, milestones, and assignment context narrow the investigation; direct Gantt actions support authorized planning changes. Configurable columns can also show Business Value, Custom Fields, and Attributes.
- Predict the commercial consequence. With Revenue entered and a B/P Scheme assigned, running Prediction calculates Predicted B/P from the predicted end date and configured rules. Predicted Revenue adjusts Revenue for that result; Predicted Profit = Predicted Revenue - Actual Cost. These are not forecasts of all future costs or final margin.
- Test the contractual rule. The Project Impact Simulator uses a project, its revenue, and an end-date variance to show the resulting bonus or penalty before applying a schema. It tests schedule-linked contractual outcomes, not complete project profitability.
- Compare and act. The Epicflow Portfolio Optimizer (EPO) proposes portfolio scenarios under real capacity limits. Its value-per-constrained-hour logic concerns the value generated by scarce capacity, not billable-hour pricing. Management selects the alternative, changes the execution plan, and reruns the forecast.
- Keep the financial boundary clear. Bonus/Penalty and Actual Revenue follow the current due-date calculation; Actual Profit = Actual Revenue - Actual Cost. These product labels do not establish collected cash or accounting revenue recognition. Actual Cost does not calculate displaced value, and Epicflow does not replace ERP/accounting or a full EAC model.
Conclusion: Act Before the Budget Turns Red
Project cost management is a control loop: plan, estimate, risk-test, baseline, measure, forecast, and intervene. In shared-resource portfolios, that loop must account for queues competing for scarce specialists, not just recorded spending.
Start with a project whose delivery forecast threatens a commercial commitment while its budget still appears healthy. Identify the constraint, compare feasible interventions, and involve finance in evaluating consequences across affected projects. Choose the action that protects portfolio value after its cost and displaced work are considered, not simply the cheapest local task.
Book a call with our team to see how Epicflow connects resource-aware delivery forecasts with approved budgets and schedule-linked financial outcomes across your portfolio.
Sources and Methodology
This guide draws on the PMI Central Italy Chapter’s cost-management teaching materials, the U.S. GAO’s cost-estimating guidance, the U.S. Department of Energy’s EVM tutorial, and AACE International’s lifecycle framework. The shared-resource interpretation is an editorial synthesis; the three-project scenario uses explicit illustrative assumptions, not customer data.
Frequently Asked Questions
What are the four processes in project cost management?
The four core process areas used in this guide are plan cost management, estimate costs, determine the budget, and control costs. The seven operational steps separate those areas into practical decisions about uncertainty, baselines, measurement, forecasting, and intervention. They are an operating translation, not a separate official PMI process list. [1]
What is the difference between cost estimating, budgeting, and the cost baseline?
Cost estimation uses evidence and assumptions to predict the cost of project work. Budgeting aggregates estimates, addresses risk, and obtains spending authorization. The cost baseline in project management is the time-phased approved budget used to measure performance. An estimate, approved monetary budget, and baseline therefore serve different purposes.
How do you control project costs?
Control project costs by comparing actual cost and earned progress with the baseline, diagnosing variance, updating forecasts, and approving corrective changes. In shared-resource portfolios, also investigate predicted date changes and contractual exposure. Intervene before an overrun when a bottleneck already threatens delivery or value on other projects.
Which metrics should a PMO track?
A project management office (PMO) should track actual cost, cost variance, Cost Performance Index (CPI), Estimate at Completion (EAC), Estimate to Complete (ETC), Variance at Completion (VAC), contingency use, and forecast confidence. Across the portfolio, add resource overload, predicted completion dates, and contractual exposure to locate risks around shared bottlenecks that spending measures alone may miss. [3]
What is the Cost Performance Index?
The Cost Performance Index (CPI) measures cost efficiency: CPI = EV / AC, where EV is the budgeted value of completed work and AC is its actual cost. Below 1 is unfavorable; above 1 is favorable. CPI requires nonzero actual cost and does not measure revenue or profit. [3]
How do resource bottlenecks affect project costs?
A resource bottleneck can delay dependent work, create overtime or contractor costs, and trigger contractual penalties or lost bonuses. Rework at the same bottleneck can also displace valuable work on other projects without creating a new payment. Assess recorded costs and potential commercial consequences separately rather than treating them all as overspending.
What should project cost management software include?
Project cost management software should connect budgets and actual costs with scope, schedule, resources, progress, forecasts, and change decisions. For complex portfolios, evaluate resource-aware delivery forecasts, scenario testing, contractual exposure, configurable controls, and integrations. Establish which functions are native and which depend on ERP or other project-controls systems.
Does project cost management software replace ERP or accounting software?
Project cost management software complements ERP and accounting systems rather than replacing their transaction and accounting controls. The project or portfolio layer connects financial data with operational progress, capacity, delivery forecasts, and scenarios. Define data ownership and reconciliation so both teams use consistent actuals without confusing predictions with recorded financial results.