Project Financials Explained: Budget, Cost, Revenue, Penalties, and Profit
 Victoria Sokolova
.
Published
.
Project Portfolio Management
.
34 mins READ
Victoria Sokolova
.
Published
.
Project Portfolio Management
.
34 mins READ
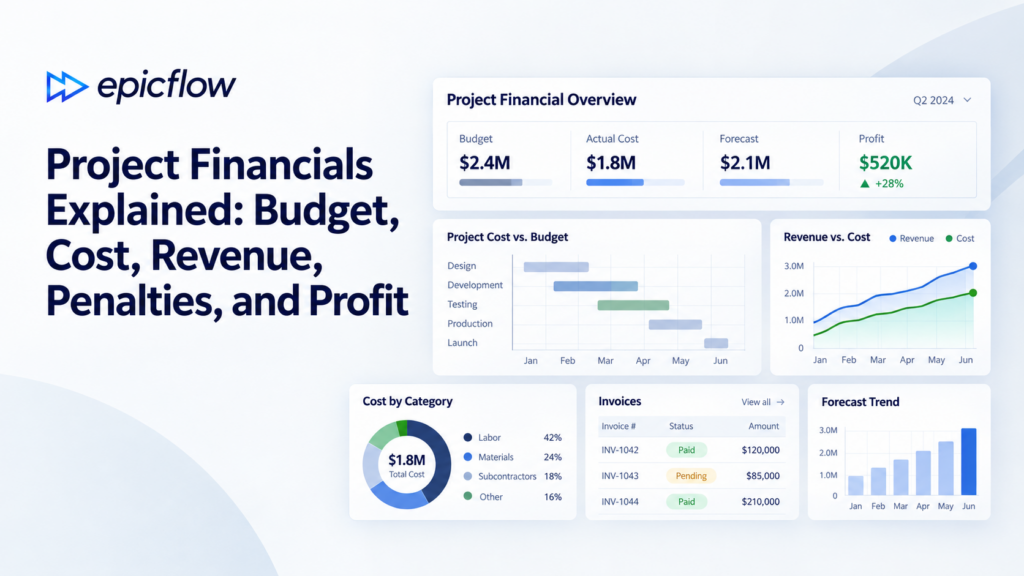
A project can sit comfortably under budget while its delivery forecast quietly erodes its commercial value. When a shared specialist becomes the queue every project waits on, completion dates slip. If the contract ties payments, bonuses, or penalties to those dates, revenue moves, and margin moves with it. Spending can stay exactly on plan the whole time.
That gap exists because project management has never put a price on time. Schedules produce dates, cost reports compare spend against plan, and neither speaks the language of the P&L. Mastering project financials means closing that gap: knowing what each field measures, what it leaves out, and how a change in dates or resource assignments turns into money. This guide covers the metrics, the process, a worked example, and the questions finance leaders should ask every month.
What Are Project Financials?
Project financials are the budget, cost, revenue, contractual, and profit measures used to understand a project's financial position. They are not the same as project finance, which describes how large capital projects are funded through debt and equity. For portfolio decisions, these measures are most useful when paired with a feasible delivery forecast rather than read only as historical accounting data.
Project management financials divide into two families:
- Resource consumption: approved monetary budget, actual costs to date, and remaining budget.
- Commercial outcome: base revenue, contractual bonus or penalty adjustments, and the adjusted revenue and profit that follow from them.
Not every project has contractual revenue. Internal and mandatory projects, such as a compliance upgrade or a new test facility, create value through new capability, lower risk, or lower operating cost. They never send an invoice, but they still have a price of time: every week they slip, the benefit they were funded to deliver arrives a week later.
Tracking consumption alone misses how execution changes commercial value. The real use of project financials is the mechanism underneath the numbers: how a change in delivery dates or resource assignments recalculates contractual adjustments, shifts expected revenue, and changes what the portfolio earns.
The Essential Project Financial Metrics
The fields below matter most when connecting project financials to delivery decisions.
Approved Budget, Actual Costs, and Remaining Budget
The Approved Budget is the approved monetary amount for the project, set from estimates and risk management assessments. It is distinct from the Work-Hour Budget, which describes planned or permitted labor effort.
Actual Costs combine recorded labor costs with spent additional costs. When Actual Costs exceed the Approved Budget, the project is over budget and the cause needs investigation.
Remaining Budget = Approved Budget - Actual Costs
Remaining Budget shows unconsumed approved funds. It is not free surplus, and it is not an estimate of the cost to complete. Further investment requires a current estimate of remaining work, its cost at applicable rates, and other remaining expenses, assessed against timing-adjusted expected value and obligations. The Work-Hour Budget describes planned effort; it neither estimates remaining monetary cost nor proves that shared specialists will be available when the work needs them.
What the cost figure is, and what it is not
Finance leaders should know the cost basis before trusting any number built on it. The labor element of Actual Costs is a management figure: recorded hours multiplied by configured rates. It is not payroll cash, and it is not a ledger entry.
What the figure excludes matters just as much. Epicflow does not spread overhead or idle capacity across projects. Spreading it is how cost reports start to mislead: idle time inflates every project's cost, a marginal project gets cancelled, the same fixed cost lands on fewer projects, and the next project looks unprofitable too. At project level, read the profit fields as contribution: what this project puts toward the fixed costs of the business. Profit for the organization as a whole exists only at portfolio level.
Revenue and the bonus/penalty scheme
For contract-based projects, Revenue is the base gross amount expected at completion. Many contracts adjust it with bonuses for early delivery or penalties for late delivery. In Epicflow, the B/P Scheme is the selected contractual rule set, and one scheme can be active per project. Linear rules change the adjustment with each day of variance; Table rules apply thresholds. The scheme is optional, but the profitability fields need a Revenue value.
Actual and predicted adjustments, revenue, and profit
Two dates drive two adjustments. Bonus/Penalty compares the current due date with the baseline end date. Predicted B/P compares the predicted end date, calculated when Prediction runs, with the same baseline. Each adjustment produces its own adjusted revenue and profit.
Both profit fields subtract the same recorded Actual Costs. Predicted Profit therefore contains no estimate of remaining delivery cost. It isolates the effect of timing on commercial value; it is not a forecast of final margin.
| Family | Field | What it means | Input or formula |
| Resource consumption | Approved Budget | Approved monetary amount for the project | Editable input |
| Resource consumption | Actual Costs | Recorded labor costs plus spent additional costs | Read-only |
| Resource consumption | Remaining Budget | Unconsumed approved funds; not the cost to complete | Approved Budget - Actual Costs |
| Commercial outcome | Revenue | Base gross amount expected at completion | Editable input; edits recalculate the profitability fields |
| Commercial outcome | B/P Scheme | Selected contractual rule set; not a monetary amount | Editable selection, one per project |
| Commercial outcome | Bonus/Penalty | Adjustment from the current due date versus baseline | Read-only, from the scheme |
| Commercial outcome | Actual Revenue | Revenue adjusted for the current Bonus/Penalty; not revenue earned, recognized, invoiced, or received | Revenue + Bonus/Penalty |
| Commercial outcome | Actual Profit | Current-state profit; not final realized profit | Actual Revenue - Actual Costs |
| Commercial outcome | Predicted B/P | Adjustment from the predicted end date versus baseline | Read-only, calculated when Prediction runs |
| Commercial outcome | Predicted Revenue | Modeled commercial outcome; not a receipt or cash forecast | Revenue + Predicted B/P |
| Commercial outcome | Predicted Profit | Modeled profit with no estimate of remaining cost | Predicted Revenue - Actual Costs |
Adjustments are signed: bonuses are positive, penalties negative. Adjusted revenue is always base Revenue plus the signed adjustment. Three dates drive the commercial fields:
- Baseline end date: the fixed reference the contract measures against.
- Current due date: the date the project is currently committed to.
- Predicted end date: the date Prediction calculates from the work remaining and the people available.
Actual vs predicted project financials
In project financial analysis, a project can carry one actual value and a different predicted value at the same moment. That is expected, not an error: the two states answer different questions.
Two dates, two states
The current due date and the predicted end date produce separate adjustments under the configured scheme. Each changes its corresponding revenue field. Both profit fields subtract the same recorded Actual Costs at the reporting snapshot. A due-date change does not itself change base Revenue, and it does not renegotiate the contract.
The documented update events are simple. A due-date change recalculates Bonus/Penalty. A Prediction run supplies the date for Predicted B/P. A Revenue edit recalculates the profitability columns. The current state shows what the commitment is worth; the predicted state shows what the plan, built around the people actually available, is likely to be worth. This is where project management forecasting software earns its place, and where project management financial analysis becomes forward-looking instead of a record of the past.
A penalty is only the visible part of delay
Contractual bonuses and penalties are the part of delay that shows up in a field. They are not the whole effect. Delivering on a different date has three financial consequences: revenue arrives later, money received later is worth less, and contractual bonuses or penalties apply on top of both. A project with no penalty clause can still lose significant value through delay, and a penalty cap can make further delay look free when it is not. Treat the contractual adjustment as the floor of the cost of delay, not its total.
Project Financials vs Project Accounting
Most finance technology, including the new wave of AI tools for the finance office, makes the rear-view mirror clearer: faster close, cleaner reporting, quicker variance analysis. That is valuable, but margin is not made at the reporting layer. It is made earlier, when the organization decides which projects get its scarce people and in what order. By the time a variance reaches the ledger, the resource conflict behind it has usually been costing money for weeks.
Project financials work at that earlier layer. Project accounting keeps the official record.
| Project financials in PPM | Accounting and ERP |
| Model delivery-linked contractual exposure | Maintain ledger records |
| Calculate adjusted revenue from current and predicted dates | Apply revenue-recognition policy |
| Forecast when milestones become invoiceable | Issue invoices and manage collections |
| Support intervention decisions before dates slip | Produce statutory and tax reporting |
Accounting systems can forecast too; the difference is the input. A forecast built from the ledger extends the past. A forecast built from a resource-feasible schedule moves when the plan moves. The two views complement each other.
A field called Actual Revenue in a project management tool is not recognized revenue or cash received. It is an operational figure for comparing cost, base revenue, and time-driven adjustments.
Decide which system owns each number
Most organizations hold several systems that each believe they know the revenue figure. The CRM holds contract value, billing holds what was invoiced, accounting holds what was recognized, and the PPM tool holds what the current plan is worth. Each is right about its own question. Before building a project financials report, name the authoritative system for each figure and print that on the report. Differences between systems then become expected and explainable instead of a weekly argument. Accounting policy, tax treatment, and revenue-recognition rules vary, so Finance should confirm these boundaries for each organization.
The Project Financial Management Process
Project financials belong in the PMO's operating rhythm without turning the PMO into an accounting department. A compact sequence works for most organizations:
1. Agree inputs and owners. Finance and commercial owners validate budgets, rates, contract rules, and Revenue. PMO and project teams maintain baseline and current dates and shared resource availability.
2. Establish the current state. Combine recorded costs with the current due date to show present contractual exposure.
3. Run the delivery forecast. Generate predicted end dates from the work remaining and the people available, producing the predicted state alongside the actual one.
4. Investigate differences. Trace each gap between the two states to the date change or resource conflict behind it. This is where project financials tracking pays for itself.
5. Decide and execute. Leadership weighs each intervention against its cost and its effect on other projects. After leadership selects an intervention, reflect the changes in the operating plan. Review the updated delivery forecast and contractual exposure using current assumptions. Expected cash timing can join this review where configured.
One rule for step 5: before investing in more capacity, model where the next queue forms. Relieving the team everything waits on moves the limit to the next team in line, and only the value achievable up to that point belongs in the business case. The best place to invest is where a dollar removes the most time-sensitive loss, which is not always the busiest team.
Review cadence depends on contract structure and how volatile the portfolio is. Finance owns monetary validity; project teams drive operational execution.
Keep these numbers out of personal KPIs
Project financial fields are decision signals, not performance targets. Once a metric becomes a personal goal, people learn to move the metric instead of the outcome. There is a structural trap as well: when a department is measured on the revenue of its own projects, its manager has every reason to hold on to spare specialists rather than lend them where the portfolio would earn more. Keep revenue and profit at project and portfolio level, and measure departments on what they control, such as idle capacity.
Five questions for the monthly review
1. Where are we losing value to delay rather than to overspend?
2. For each major project, what will the remaining spend buy?
3. If we move a shared specialist, which other project slips, and what does that cost?
4. Which payment milestones are at risk, and by how much?
5. Which system owns each number on this report?
What a Project Financials Dashboard Should Show
To trace a financial difference to its delivery cause, a dashboard must put money and dates in the same row. Each project row should show the cost family, base Revenue, the selected scheme, current and predicted adjustments, adjusted revenue and profit, and the three dates that drive them.
Project rows alone are not enough. A portfolio can look profitable when each project is read in isolation, then turn loss-making once competition for shared specialists is taken into account. Adding up project P&Ls silently assumes every project gets its people when it needs them. In a shared-resource environment, capacity planning decides which dates are feasible, so the dashboard has to reflect the schedule effect, not just the sum.
Cost basis matters at each level. A portfolio view can carry the full fixed cost of the resource pool. Filter that same view to one project and the project appears to carry the whole payroll. Project views should cost a project by the hours it demands from the pool; portfolio views carry the fixed cost. Two views, two cost bases, both clearly labeled.
When evaluating project financial management tools, test five capabilities:
- Trends: Does financial health degrade over time, or did a single event cause the variance?
- Drill-down: Which work package, resource conflict, or milestone shift triggered this adjustment?
- Access permissions: Can users see the financial context they need without exposing sensitive commercial rates?
- Custom fields and context: Can financial metrics be filtered alongside operational classifications and project metadata?
- Traceability to inputs: Which date change or Prediction run produced the current profit figure?
Epicflow's Pipeline supports this with a per-user column configurator that places financial fields beside Custom Fields, Attributes, and contextual filters. It compares project-level outcomes across the portfolio; it does not produce consolidated statutory accounting totals.
Example: a Predicted Delay Changes Contractual Value
Can a budget stay unchanged while predicted financial exposure gets worse? Yes. The following case is illustrative: the dates and contract terms are teaching assumptions, not a simulated schedule, software output, or customer result.
The delivery context
Project A depends on a shared test specialist who is currently committed to Project B. Project A's due date stays at Day +4 throughout the comparison. The resource conflict pushes its predicted end date to Day +10.
| Input | Illustrative value or assumption |
| Approved Budget | $800,000 |
| Actual Costs | $600,000 at the same snapshot for both states |
| Base Revenue | $1,000,000, unchanged between the states |
| Baseline end date | Day 0, fixed reference throughout |
| Current due date | Day +4 |
| Predicted end date | Day +10 |
| Grace period | 2 whole calendar days after baseline |
| Penalty rule | 1% of base Revenue per whole day beyond the grace period |
| Maximum penalty | 5% of base Revenue |
| Other assumptions | No bonus, rate change, new cost, payment timing, tax, or revenue recognition |
| Measure | Current due-date state | Predicted delivery state |
| Timing input | Day +4 | Day +10 |
| Base Revenue | $1,000,000 | $1,000,000 |
| Signed adjustment | -$20,000 | -$50,000 |
| Adjusted revenue | $980,000 Actual Revenue | $950,000 Predicted Revenue |
| Actual Costs at snapshot | $600,000 | $600,000 |
| Profit field | $380,000 Actual Profit | $350,000 Predicted Profit |
| Remaining Budget | $200,000 | $200,000 |
At Day +4, two penalty days cost 2% of base Revenue, or $20,000. At Day +10, eight penalty days would cost 8%, but the cap limits the penalty to 5%, or $50,000.
Interpreting the output
Project A still has $200,000 of unconsumed budget, yet its predicted end date implies $30,000 more contractual exposure than its current state. That $30,000 is modeled exposure, not a paid penalty. Because both profit fields subtract the same Actual Costs, the revenue gap and the profit gap are one effect; do not add them together.
What will the remaining spend buy?
Remaining Budget cannot say whether finishing is worthwhile. Suppose the team estimates $250,000 of remaining cost to complete.
| Measure | Illustrative value |
| Remaining Budget | $200,000 |
| Estimated remaining cost to complete | $250,000 |
| Forecast total cost | $850,000, which is $50,000 over the Approved Budget |
| Predicted Profit field | $350,000, with no remaining cost included |
| Margin including remaining cost | $100,000 |
| Return on total investment | 11.8% |
| Return on remaining investment | 3.8x ($950,000 / $250,000) |
Three lessons follow. First, a project under budget today can be heading over it, and Remaining Budget cannot show that. Second, Predicted Profit isolates timing and overstates final margin when remaining costs are large. Third, the decision to finish should ignore money already spent. On total investment, this project barely pays. On what is left to spend, every remaining dollar buys $3.80 of revenue, so finishing is clearly worth it.
Epicflow calls this multiple RRI, return on remaining investment, building on Stephen Devaux's work on managing projects as investments. The multiple grows very large as a project nears completion, so read it next to ROI and never rank a mixed-stage portfolio on it alone. Its flip side is useful: nearly finished projects are often the best use of scarce people, the opposite of the instinct that pulls specialists toward new work.
Should the specialist move to Project A?
Moving the test specialist to A pulls A forward but delays B. Assume the move brings A's predicted end from Day +10 to Day +6 and pushes B's from Day 0 to Day +5. Project B has $600,000 base Revenue, a one-day grace period, and a penalty of 1.5% per whole day, capped at 10%.
| Measure | Project A | Project B |
| Predicted end before the move | Day +10 | Day 0 |
| Predicted end after the move | Day +6 | Day +5 |
| Penalty before the move | -$50,000 | $0 |
| Penalty after the move | -$40,000 | -$36,000 |
| Change | +$10,000 | -$36,000 |
The portfolio loses $26,000 before any acceleration cost. Under these assumptions, the specialist should stay on B.
The cap shapes this result. Improving A from Day +10 to Day +7 is worth nothing, because every date from Day +7 onward already hits the 5% cap. Even Day +8, two days better, still leaves the penalty at $50,000. A faster finish does not automatically reduce contractual exposure.
The general rule: on a single project, a day of acceleration looks created. Across a portfolio that shares people, it is borrowed from another project. Move a shared resource only when the value gained exceeds the value lost elsewhere plus the cost of acceleration, such as overtime or a contractor, which is recorded separately from any bonus. A contractor for A, for example, pays only if it costs less than $10,000 and actually reaches Day +6. The true cost of any task is its resource cost plus the delay it causes the project, which Devaux called drag cost.
Test both outcomes in What-If Analysis before changing the assignment. A due-date edit alone does not establish a feasible improvement. B's delay would also move its milestone payments later, which matters for cash even where no penalty applies.
How Epicflow Connects Delivery with Project Financials
Epicflow is an enterprise project portfolio management tool built around resource-constrained delivery prediction: dates come from the work remaining and the people actually available. Project financials sit on top of that prediction, so the money moves when the plan moves.
Financial and delivery context in Pipeline
Pipeline 2.0 displays cost and profitability fields beside delivery dates, Custom Fields, and Attributes. The configured scheme evaluates Linear or Table rules against the current due date for the actual adjustment and against the predicted end date for the predicted one:
- Revenue + Bonus/Penalty = Actual Revenue
- Revenue + Predicted B/P = Predicted Revenue
- Predicted Revenue - Actual Costs = Predicted Profit
The last formula contains no estimate of remaining cost, which is why the worth-finishing view uses remaining investment rather than Remaining Budget.
Contractual tests and portfolio decisions
The Project Impact Simulator tests one project, its base revenue, and a projected end-date variance against the scheme. It is a focused contractual-impact test. It does not determine resource-feasible portfolio dates and is not a substitute for portfolio What-If Analysis, which models how a change on one project moves the others.
Expected cash timing
Money rarely arrives at the project end date. It arrives at milestones: a stage payment, a design approval, a delivery. An activity far from the project's critical path can still be the one delaying a payment, and measured only at the end date, its delay looks free. Epicflow's Cash Flow links configured payments to the resource-constrained schedule. Invoice Forecast estimates when configured milestones become invoiceable; Cash Flow applies payment terms to forecast payment timing. Moving a milestone can move expected cash without changing contract value.
Two projects with equal profit can have very different cash curves. When they compete for the same specialist, the one that brings cash in sooner may deserve priority. Earlier cash is not automatically extra profit, and these forecasts do not confirm invoice issuance or collection.
Where Epicflow stops
Epicflow forecasts when milestones become invoiceable; it does not issue invoices. Ledger records, revenue recognition, collections, and treasury remain the responsibility of accounting and ERP systems. Epicflow forecasts; the ERP records.
See how Epicflow connects delivery forecasts and project financials.
Frequently Asked Questions
What are project financials?
Project financials are the budget, cost, revenue, contractual, and profit measures that describe a project's financial position. They connect delivery with commercial outcome by setting budgets, actual costs, base revenue, and contractual adjustments against current and predicted dates. Delivery dates can change contractual adjustments and expected commercial value, even when recorded costs remain unchanged.
Which financial metrics should a project manager track?
Track Approved Budget, Actual Costs, and Remaining Budget for consumption. Then track base Revenue, current and predicted bonus or penalty adjustments, adjusted revenue, and both profit fields, together with the baseline, current due, and predicted end dates that drive them. Predicted Profit subtracts only recorded costs, so pair it with an estimate of remaining cost before judging final margin.
What is the difference between project financial management and project accounting?
Project financial management uses current and predicted delivery dates to model contractual exposure, expected revenue, and the effect of interventions before they happen. Project accounting maintains the official record: ledger entries, revenue recognition, invoicing, collections, and statutory reporting. Accounting can also forecast, but from the ledger. The two are complementary and need shared definitions and a clear handoff.
Who owns project financial data: the PMO or Finance?
A recommended model, to agree locally: Finance owns monetary definitions, approved budgets, rates, contract rules, and revenue-recognition policy. The PMO and project teams own delivery inputs, including baseline and current dates, progress, and shared resource assignments. Name the authoritative system for each figure, and keep these fields out of personal KPIs so they stay honest decision signals.
How can project financials be forecast across a portfolio?
contractual rules, and compare project-level outcomes side by side. Then test each intervention for its effect on other projects, because a resource move that helps one project can cost another more. Company-level Cash Flow is a separate view that forecasts payment timing across the business.
Project financials are only as reliable as the dates beneath them. A budget can hold while value leaks through delay, and a faster finish on one project can cost more on another. Finance leaders who stay ahead put a price on time, judge what the remaining spend will buy, weigh every resource move across the portfolio, and watch when cash will actually arrive.