What Should a Project Portfolio Management Dashboard Show? 12 Decision-Critical Views
 Mykhailo Kulakov
.
Published
.
Project Portfolio Management
.
33 mins READ
Mykhailo Kulakov
.
Published
.
Project Portfolio Management
.
33 mins READ
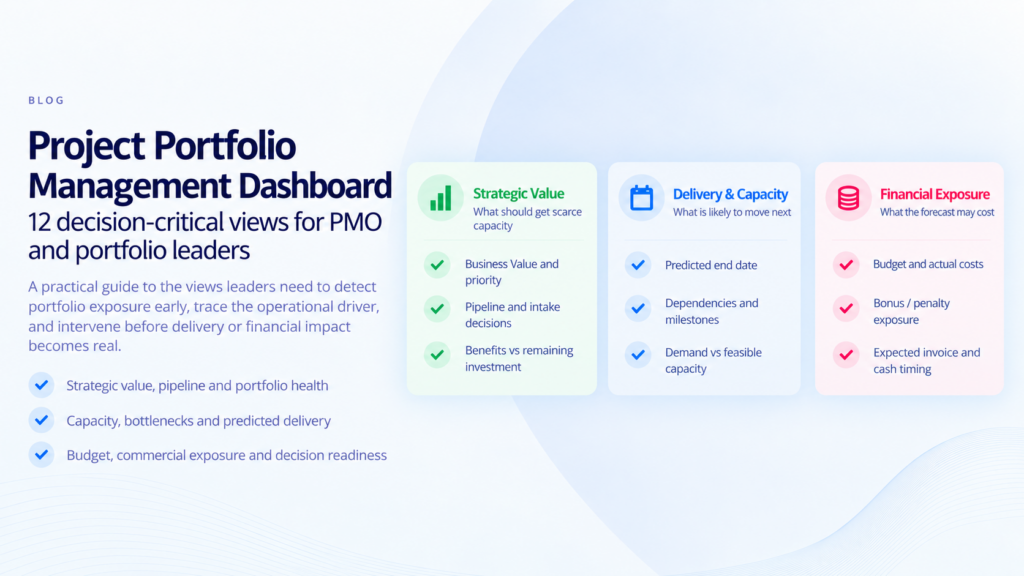
Most portfolio dashboards answer only “what is happening,” cluttering screens with historical actuals and lagging KPIs. But static visibility alone does not show leaders where intervention can still change the outcome. A decision-ready project portfolio management dashboard functions as decision architecture: it shows where the portfolio is heading based on finite capacity constraints, what is driving the exposure, and what leaders can still change to protect delivery and commercial outcomes.
When an organization manages competing commitments across shared resources, high-level status without the underlying operational constraint offers little support against schedule slippage or margin erosion. A portfolio dashboard should surface predicted exposure at a cadence aligned with signal volatility and decision rhythm, so leaders can intervene before forecast risk becomes realized delay or financial loss.
Below are 12 decision-critical views a project portfolio management dashboard should support.
What is a Project Portfolio Management Dashboard?
A project portfolio management dashboard is a shared cross-project decision view that brings together portfolio health, resource capacity, business value, risk, schedule, and financial signals across multiple projects. It helps leaders compare strategic trade-offs, investigate operational exceptions, and determine whether to start, delay, re-resource, or escalate work to protect delivery and commercial outcomes.
Traditional reporting summarizes past performance. A portfolio dashboard adds forward-looking context for comparing trade-offs and intervening across competing initiatives.
To select the right tool and configuration, leaders must distinguish a project portfolio management dashboard from single-project, program, and traditional PMO reporting views:
| Dashboard type | Primary focus | Key metrics & Data tracked | Core target audience |
| Project dashboard | Day-to-day execution of a single project. | Task completion rates, milestone burn-down, individual workload, immediate blockers (bugs or resource overload). | Project managers, scrum masters, project teams. |
| Program dashboard | Operational coordination across a group of related projects sharing a common outcome. | Inter-project dependencies, combined benefits realization, shared resource conflicts, program milestone alignment. | Program managers, delivery directors. |
| PPM dashboard | Strategic alignment, ROI, and resource optimization across all organizational initiatives. | Portfolio health, budget vs. actual spend, strategic value alignment, cross-portfolio resource capacity. | C-suite executives, portfolio directors, PMO leaders. |
| PMO dashboard | Governance standard enforcement and delivery capacity across portfolios. | Process compliance, resource utilization rates, pipeline velocity, standard SLA performance, methodology adherence. | PMO managers, operations directors, governance leads |
Additionally, portfolio project management dashboard unifies baseline plans with capacity constraints and predicted outcomes to guide informed leadership decisions.
Read More: PPM Resource Management: Complete Guide to Optimizing Portfolio Resources
What Makes a Project Portfolio Dashboard Decision-Ready?
A truly decision-ready project portfolio dashboard gives leaders immediate clarity on where and how to intervene. To evaluate whether a dashboard supports strategic decisions for your company, it must pass five core operational tests:
- Portfolio scope. Evaluates competing commitments across shared resources.
- Current data. Guarantees data freshness and explicit ownership so management can trust the information before acting.
- Thresholds. Uses clear schedule variance limits and contractual or operational triggers instead of arbitrary color-coding.
- Drill-down. Enables a direct path from high-level portfolio signals down to the root cause in the underlying phase or resource constraint.
- Actionability. Provides clear paths to re-sequence work or reallocate scarce capacity.
A decision-ready PPM dashboard balances both timeline and performance dimensions to evaluate systemic health, by applying a unified conceptual framework across every view. To transform raw project data into actionable governance, each view follows a repeatable decision path:
| Role | Decision | Signal | Consequence | Driver | Action |
- Primary role: Identifies the explicit operational owner of the recurring choice.
- Decision: Defines the specific governance trade-off being made (for instance, start or delay).
- Signal: Captures the minimum viable metrics required to spot an emerging condition.
- Consequence: Connects the signal to its forward-looking schedule, financial, or strategic impact.
- Driver: Traces the consequence down to its root cause in a specific phase or capacity bottleneck.
- Action: Provides a direct execution path to implement the necessary intervention.
To give this architecture structural clarity, all 12 portfolio views organize signals into three distinct information layers:
- Outcome & economic signals: Forward-looking and historical results, including Business Value, delivery confidence, budget variance, predicted profit, and forecasted cash timing.
- Flow, schedule & resource drivers: The operational engines shaping performance. It includes predicted end dates, phase/milestone health, predecessor dependencies, demand-capacity balance, and bottleneck queues.
- Organizational context: The structural framing necessary to interpret signals correctly. It includes custom fields, portfolio themes, contract attributes, data freshness timestamps, and decision rights.
| Metric dimension | Core focus | Operational example | Value proposition |
| Leading indicators | Forward-looking inputs & behaviors | Predicted-date movement, queue depth, demand-capacity imbalance | Identifies emerging bottlenecks early. |
| Lagging indicators | Backward-looking outcomes & results | Actual costs, actual bonus/penalty, completed milestones | Validates whether historical strategies delivered the expected strategic value. |
| Actual performance | Current execution state | Actual costs to date, current milestone status | Establishes grounded operational facts and tracks performance against plan. |
| Predicted forecasts | Model-driven future projections | Predicted end date, predicted bonus/penalty, predicted revenue/profit | Enables proactive interventions before budget overruns materialize. |
Read More: Trends in Project Portfolio Management: What’s Next in PPM
The 12 Views Every Project Portfolio Management Dashboard Should Include
| Strategy & Value View 1 | Portfolio Flow Views 2-3 | Delivery Views 4-5 |
| Capacity Views 6-7 | Risk & Finance Views 8-10 | Outcomes & Governance Views 11-12 |
1. Which work is worth scarce capacity? - Strategic alignment & Business Value
| Spec | Direction |
| Primary role | Executive sponsor, PMO/portfolio director |
| Minimum fields | Strategic objective / portfolio theme; Business Value; priority or approved status; outcome/benefit owner. |
| Consequence | Prevents low-value work from looking equal to high-value commitments simply because both are “on track.” |
| Drill-down | Move from project value to the phase/milestone carrying the value; inspect the capacity or schedule trade-off that may block it. |
| Next action | Reconfirm priority, defer lower-value work, escalate a strategic conflict, or send a scenario for deeper analysis. |
| Cadence / threshold | Monthly/quarterly strategy review, plus exception-based review. |
2. What should enter or move through the portfolio next? - Pipeline & intake
| Spec | Direction |
| Primary role | PMO/portfolio director, governance board |
| Minimum fields | Pipeline stage/status; requested/approved start; priority; strategic/value context; critical resource demand; readiness/dependency flags; owner. |
| Consequence | A pipeline must expose whether starting more work creates a queue for scarce expertise or dilutes existing commitments. |
| Drill-down | Inspect the scarce skills/dependencies the incoming work would consume and which active projects would be affected. |
| Next action | Start, hold, sequence, request more evidence, or run a scenario before committing. |
| Cadence / threshold | Weekly/biweekly intake review; thresholds tied to available capacity and portfolio governance rules. |
3. Which projects require intervention now? - Portfolio health & exceptions
| Spec | Direction |
| Primary role | PMO director, delivery leader, executive sponsor |
| Minimum fields | Compact current status; predicted status/delivery; exception reason; priority/value; owner; key threshold breach. |
| Consequence | RAG alone encourages “traffic-light theatre.” A static status tile states an isolated outcome, whereas a decision view connects that signal to its operational driver, consequence, and direct intervention path |
| Drill-down | Open the phase, milestone, dependency, budget, or resource signal responsible for the exception. |
| Next action | Assign an owner, investigate, replan, re-resource, escalate, or accept the risk explicitly. |
| Cadence / threshold | Daily/weekly depending on portfolio volatility; exception-based review. |
4. Which phase, milestone, or dependency is driving the exposure? - Milestone & dependency view
| Spec | Direction |
| Primary role | Delivery/program leader, PMO |
| Minimum fields | Phase/milestone; baseline/target date; predicted/possible date where available; predecessor/successor dependencies; constraint date; Business Value context. |
| Consequence | Portfolio leaders need the point of leverage. |
| Drill-down | Filter to the affected phase/milestone, inspect linked work and dependencies, then trace to the constrained resource or planning constraint. |
| Next action | Adjust a deadline/constraint where governance allows, resolve a dependency, change sequence, or escalate the dependency owner. |
| Cadence / threshold | Weekly plus event-driven when forecast dates or dependencies move. |
5. Which deadlines are likely to move before they actually do? - Predicted delivery view
| Spec | Direction |
| Primary role | PMO, portfolio leader, delivery manager |
| Minimum fields | Baseline/current due date; predicted end date / schedule forecast; variance; milestone-at-risk indicator; confidence/assumption notes where used. |
| Consequence | The key management value is prevention. Current status can still be green while a resource-feasible prediction is already signaling future slippage. |
| Drill-down | Trace the forecast variance into demand/capacity, bottleneck, dependency, or phase-level drivers. |
| Next action | Run a what-if, re-sequence work, adjust allocation, renegotiate a commitment, or escalate early. |
| Cadence / threshold | At least weekly for active portfolios; more frequent when schedules or staffing change rapidly. |
6. Where does demand exceed feasible capacity? - Capacity & demand view
| Spec | Direction |
| Primary role | Resource/capacity leader, PMO, operations |
| Minimum fields | Demand vs available capacity by group/skill/time period; backlog/queue context; affected projects/milestones; future load window. |
| Consequence | Utilization alone cannot show whether the portfolio is feasible. A portfolio may look efficient while a scarce specialist group is the limiting factor for multiple commitments. |
| Drill-down | Inspect which projects/tasks create the overload and which deadlines depend on the constrained group. |
| Next action | Reallocate work, delay a start, protect constraint capacity, substitute a skill, or test a scenario. |
| Cadence / threshold | Weekly; daily in high-volatility resource environments. |
7. Which constrained resource is driving the queue? - Bottleneck & assignment context
| Spec | Direction |
| Primary role | Resource manager, PMO, operations/delivery lead |
| Minimum fields | Constrained skill/group; overload window; queue of dependent work; priority/value context; suggested/budgeted assignment context where relevant. |
| Consequence | The portfolio bottleneck is the point where a scarce hour has a disproportionate effect on lead time and delivery. |
| Drill-down | Move from the group to the tasks/projects waiting for it and the milestones/commercial commitments that move with the queue. |
| Next action | Protect the bottleneck, shift lower-value demand, add/substitute effective capacity, or re-sequence work. |
| Cadence / threshold | Continuous/weekly, especially around constrained specialist pools. |
8. Which risks and exceptions are becoming action-critical? - Risk & exception exposure
| Spec | Direction |
| Primary role | PMO, project controller, executive sponsor |
| Minimum fields | Risk/exception type; likelihood/impact if available; related milestone/project; threshold; owner; predicted delivery/financial consequence when defensible. |
| Consequence | The dashboard should surface risks that are approaching a decision threshold. |
| Drill-down | Connect the risk to the delivery, capacity, financial, or dependency signal making it urgent. |
| Next action | Escalate, mitigate, accept, fund contingency, or change sequence/allocation. |
| Cadence / threshold | Weekly plus threshold/event-driven review. |
9. Which projects are consuming budget faster than expected? - Budget & cost view
| Spec | Direction |
| Primary role | Project controller/Finance, PMO, project manager |
| Minimum fields | Approved Budget; Actual Costs; Remaining Budget; progress/schedule context; owner; variance threshold. |
| Consequence | Remaining budget without the work still to be completed can mislead; conversely, schedule risk without cost exposure hides the economic consequence. |
| Drill-down | Trace cost consumption to project/phase context and compare with delivery progress and forecast. |
| Next action | Investigate burn, adjust scope/sequence, reforecast, escalate budget pressure, or protect higher-value work. |
| Cadence / threshold | Weekly/monthly depending on financial close rhythm and project volatility. |
10. Where is commercial outcome at risk before it becomes actual? - Predicted financial impact
| Spec | Direction |
| Primary role | Finance/controller, PMO, executive sponsor |
| Minimum fields | Revenue; Actual/Predicted Bonus/Penalty; Actual/Predicted Revenue and Profit; predicted end date; milestone/payment trigger; predicted invoiceable timing; expected cash timing/payment term; relevant contract threshold. |
| Consequence | This view connects schedule movement to monetary exposure and timing: when a milestone may become invoiceable, when cash is expected under configured payment terms, and whether a contractual threshold may be crossed. |
| Drill-down | Trace predicted financial deterioration to the project date variance, phase/milestone, dependency, or constrained resource. |
| Next action | Reallocate scarce capacity, test a scenario, change the sequence, negotiate a commitment, or accept the exposure with an explicit owner. |
| Cadence / threshold | Weekly/exception-based; use contract-specific thresholds and grace periods. |
Worked example (illustrative): Projects A, B, and C share one systems-engineering group. A is forecast 12 days late against a 10-day penalty threshold and milestone-linked payment; B has higher Business Value but no near-term threshold; C can start later. The dashboard links the queue to A’s predicted penalty and invoice/expected-cash timing, then lets the PMO test delaying C or reallocating capacity before changing the live plan.
11. Is the work still worth the remaining investment? - Benefits & outcome view
| Spec | Direction |
| Primary role | Executive sponsor, portfolio director, Finance/VMO |
| Minimum fields | Expected benefit/outcome; Business Value; remaining investment or user-defined investment logic; completion/forecast context; owner; strategic dependency. |
| Consequence | Portfolio management should not let sunk cost become the automatic argument for continuing work. The decision should reflect what remains to be invested and what value remains to be earned. |
| Drill-down | Inspect the schedule/capacity required to realize the remaining value and the opportunity cost for other constrained work. |
| Next action | Continue, accelerate, defer, resize, or stop based on the remaining-value case. |
| Cadence / threshold | Monthly/quarterly investment review; re-open when forecast cost/date/value assumptions change materially. |
12. Can leaders trust the data enough to act? - Data quality, ownership & freshness
| Spec | Direction |
| Primary role | PMO, portfolio operations, data owner |
| Minimum fields | Data owner; last update/refresh; source/system; missing critical fields; stale forecast flag; unresolved data exceptions; permission context. |
| Consequence | Decision rights and freshness are part of the dashboard design. |
| Drill-down | Identify which source/owner is blocking trustworthy interpretation and whether the affected decision should be deferred. |
| Next action | Fix the source, assign ownership, set refresh cadence, restrict visibility, or mark the decision as data-insufficient. |
| Cadence / threshold | Continuous governance, with explicit freshness standards by signal type. |
Read More: PPM Tool Requirements: The Complete Guide to Selecting the Right Project Portfolio Management Tool
Project Portfolio Management Dashboard Examples by Role: Tailoring Views Across Project Portfolios
A portfolio management dashboard should never present an identical wall of data to every stakeholder. Different leadership roles require different lenses over the same underlying project data. Thus, designing an effective portfolio project management dashboard means surfacing the minimum viable signals needed for each role's recurring choices, hiding operational clutter that causes cognitive overload at the same time.
| Role | Default decision view | Hide by default / review rhythm |
|---|---|---|
| Executive sponsor / COO | Business Value; portfolio exceptions; predicted delivery; commercial/financial exposure; key bottleneck risk. | Task lists, detailed assignments, raw individual utilization; monthly plus exception-based review. |
| PMO / portfolio director | Pipeline/intake; portfolio health; milestones/dependencies; predicted delivery; capacity/bottlenecks; data quality. | Every financial field and every task; weekly portfolio review plus exception-based escalation. |
| Resource / capacity leader | Demand vs capacity; bottleneck queues; assignments; affected milestones/projects; scenario trigger. | Unrelated financial detail and broad strategic scorecards; weekly, or daily in volatile capacity periods. |
| Project controller / Finance | Approved Budget; Actual Costs; Remaining Budget; Actual/Predicted B/P; Revenue/Profit; delivery threshold. | Task-level workflow unless it explains an exception; financial-close rhythm plus threshold-based review. |
| Delivery / program leader | Phase/milestone health; dependencies; constraints; predicted date; bottleneck context; direct action path. | Enterprise-wide KPI clutter that does not change the delivery decision; weekly plus event-driven review. |
Read More: Multi-Resource Scheduling: Strategies, Examples & Software
How to Build a Project Portfolio Management Dashboard Template for Enterprise Teams
Build the dashboard around recurring decisions, not the fields already available in spreadsheets. For enterprise portfolios, use the seven-step method below to define ownership, minimum signals, thresholds, drill-down, actions, and review cadence.
- Identify recurring decisions: Map the exact operational choices governance reviews must make. It can be, for instance, reallocate scarce skills, re-sequence phase deadlines, escalate contractual risks, or terminate underperforming work.
- Assign role decision rights: Define explicit ownership for every view, specifying who reviews the project data and what parameters they are authorized to modify.
- Select minimum viable signals: Limit each view to the smallest combination of outcome, driver, and context fields required to execute the target decision.
- Define a metric/data dictionary: Standardize field definitions, data owners, calculation logic, and explicit labels for baseline versus forecast values.
- Set thresholds and exception rules: Set quantitative variance triggers using contractual dates or budget rules. For better efficiency, avoid arbitrary color coding.
- Design drill-down and action paths: Ensure users can move directly from a portfolio-level alert down to the underlying phase or dependency to make updates.
- Set refresh and review cadence: Match data update requirements to signal volatility and hold designated owners accountable for stale information.
Portfolio Metric & Data Dictionary Template
Use a metric/data dictionary to keep definitions, ownership, thresholds and forecast states consistent across the portfolio.
| Field / signal | Definition | Source / owner | Actual or predicted? | Threshold | Decision / action |
| Predicted end date | Forecast completion date from current plan/capacity assumptions. | Planning engine / PMO | Predicted | Contract / governance specific | Investigate driver; run scenario; re-resource or escalate. |
| Remaining Budget | Approved Budget minus Actual Costs. | Financial/project data / Controller | Actual/current | Project-specific | Investigate burn and remaining work. |
| Business Value | Organization-defined value context for project/phase. | Portfolio governance | Current/context | Portfolio-specific | Prioritize scarce capacity or review investment. |
Read More: Project Profitability Analysis: The Ultimate Guide to Metrics, Formulas, and Management
Common Mistakes When Designing Portfolio Dashboards for Multiple Projects
Frequently, while building project portfolio dashboards, companies keep repeating structural design errors that reduce strategic value. To design an effective project portfolio management dashboard environment across your project portfolio, you need to eliminate eight common failure modes:
- Traffic-light theatre: It displays a RAG (red-amber-green) status without underlying threshold logic, root cause analysis, or forward-looking forecasts. To fix this project portfolio dashboard bottleneck, pair exception conditions with financial or operational consequences, operational drivers, assigned owners, and explicit next decisions.
- One dashboard for everyone: Forcing all stakeholders and executives to consume identical visual detail. To fix this project management problem, configure role-specific lenses over a unified portfolio dataset.
- Current state without prediction: Relying solely on historical project portfolio actuals, which prevents timely interventions. To fix it, pair actual/current state with forecast state where action can change the outcome.
- Utilization as the capacity story: Assuming high team utilization equals healthy project portfolio execution while ignoring bottleneck queues. To fix this problem, expose demand versus capacity by scarce skill groups, bottleneck queue length, and affected milestones.
- KPI maximalism: Overloading portfolio management dashboards with dozens of metrics, which creates cognitive clutter and hides key signals. To fix it, surface only the minimum viable signals needed for each role's recurring project management choices.
- No baseline vs. forecast distinction: Failing to explicitly label whether a date or financial figure represents committed baselines or dynamic predictions. Fix it by clearly labeling state and comparison basis.
- No owner or freshness standard: Data may be accurate-looking but too stale or ownerless to support action. Fix this project portfolio bottleneck by governing metadata and refresh rules.
- No path from exception to action: Treating the project portfolio management dashboard as a dead-end presentation layer. To fix it, define direct drill-down paths and direct Gantt or capacity intervention controls for every major view.
Read More: Project Budget Management: Why Work-Hour and Monetary Budgets Need Separate Controls
How Epicflow Serves as an Enterprise Project Portfolio Management Software Dashboard
Once the decision architecture is defined, the challenge is connecting portfolio signals to the operational plan so leaders can act without switching contexts. Epicflow applies this model as enterprise project portfolio management software for complex multi-project environments.
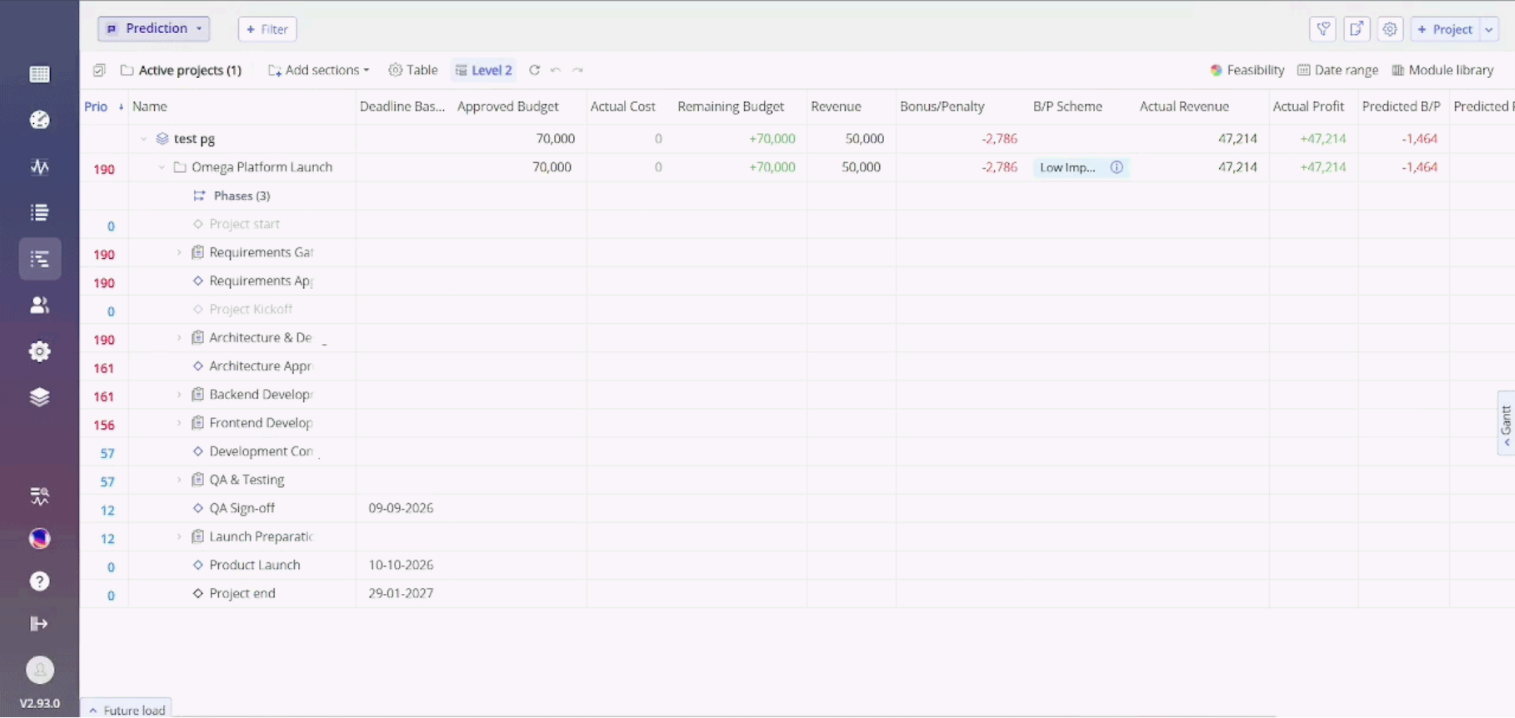
Pipeline 2.0: actual and predicted financial signals in one portfolio view.
Through Pipeline 2.0 and its planning engine, Epicflow operates as a closed decision control loop:
Finite capacity → feasible schedule → predicted economic consequence → scenario → intervention → execution.
- Finite capacity (the driver): The Future Load view maps cumulative workload against real-world team availability. It exposes skill group queues and bottleneck constraints early, avoiding reliance on misleading utilization averages.
- Feasible schedule (the flow): Epicflow calculates dynamic, resource-feasible predicted dates from finite capacity constraints, exposing schedule slippage before static baseline deadlines are breached.
- Predicted economic consequence (the outcome): Pairing Revenue and Bonus/Penalty schemas with Predicted Profit (Predicted Revenue - Actual Costs) translates schedule variance into monetary exposure. The Release 93 Cash Flow layer separately links resource-feasible milestone timing to Invoice Forecast and payment terms to expected Cash Flow—forecast timing, not collections, receipts, or bank balance.
- Simulated scenario (the decision): When an exception is flagged, leaders run What-If scenario analyses to simulate re-sequencing options or deadline shifts before committing changes to active project portfolios.
- Direct intervention & execution (the action): Leaders can move from diagnosis to intervention in the same operational workspace. Pipeline 2.0 role-specific columns, Phase Context Menu, and direct Gantt interactions let leaders adjust constraints, task durations, or phase deadlines without separating the management decision from the plan teams use.
See how Epicflow connects resource-feasible forecasts, commercial exposure, and direct portfolio intervention in the same operating plan. Contact our team today.
Conclusion
An effective project portfolio management dashboard should not show every metric available. It should give each decision owner the minimum context required to see what outcome is at risk, trace it to the operational constraint, and intervene while the result can still change.
When portfolio views connect finite capacity to schedule predictions and commercial consequences, leaders can protect delivery and make strategic trade-offs with a clearer view of what each intervention changes.
FAQs
What is a portfolio dashboard?
A project portfolio management dashboard is a cross-project decision view that brings together portfolio health, resource capacity, business value, risk, schedule, and financial signals across multiple projects. It differs from a single-project dashboard primarily by enabling leaders to compare cross-project trade-offs and evaluate capacity feasibility.
What should a project portfolio management dashboard include?
A portfolio management template includes 12 essential views grouped into six core operational categories:
• Strategy & Value: Strategic alignment scores and value realization.
• Flow & Delivery: Portfolio health exceptions and cross-project milestones.
• Capacity: Demand versus feasible capacity and bottleneck exposure.
• Risk: Critical exception exposure and risk threshold alerts.
• Finance: Budget vs. actuals, variance, and forecasts.
• Outcomes & Governance: Remaining-value decisions, data ownership, and decision readiness.
How do you create a PMO dashboard?
To create a decision-ready PMO dashboard, follow a structured seven-step method:
1. Identify recurring governance decisions.
2. Assign role decision rights.
3. Select minimum viable signals.
4. Establish a metric dictionary.
5. Set quantitative variance thresholds.
6. Design drill-down and direct action paths.
7. Align data refresh cadences with decision rhythms.
What is the difference between a project management dashboard and a portfolio dashboard?
A project management dashboard focuses on single-project execution, targeting project managers with detailed task actuals and daily operational processes.
A dashboard for managing project portfolios covers multi-project scope across shared resource pools. It is primarily designed for executives, PMO directors, and controllers, and provides aggregated phase views, finite capacity load, predicted profit, and threshold exception signals to drive strategic trade-offs.
How often should a portfolio dashboard be updated?
There is no universal update cadence for portfolio dashboards. Data refresh rates must be tied directly to signal volatility and governance decision rhythms. While baseline financial actuals and strategic value scores may update monthly, dynamic delivery forecasts and resource capacity loads generally require more frequent refresh or recalculation, aligned with how quickly underlying project signals change and how often leaders can intervene to prevent missed commitments.
Which metrics belong on an executive PPM dashboard?
Executive PPM dashboards apply minimum viable information to keep leaders focused on high-level choices. It prioritizes five core areas: strategic value, delivery confidence, constrained-capacity risk, commercial/financial exposure (including budget pressure, predicted profit, contractual bonus/penalty exposure, and expected cash timing), and threshold exceptions. Detailed task updates, sub-phase dependencies, line-item expenses, and individual resource assignments should be hidden by default to avoid cognitive overload.