Project Portfolio Management Metrics: 15 KPIs that Connect Delivery to Financial Outcomes
 Victoria Sokolova
.
Published
.
Project Portfolio Management
.
38 mins READ
Victoria Sokolova
.
Published
.
Project Portfolio Management
.
38 mins READ
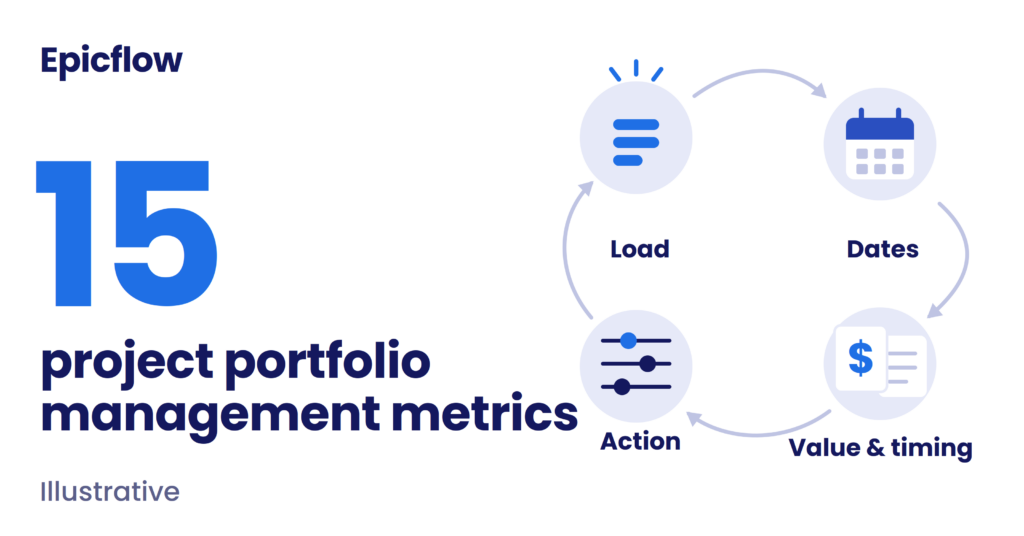
Project portfolio management metrics are the measures a PMO uses to check whether the portfolio is selecting valuable work, matching demand to the capacity it actually has, delivering predictably, controlling cost and risk, and realizing the outcomes it was funded for. A metric becomes a KPI when it has a calculation, an owner, a review cadence, a threshold and a decision attached to it.
You will recognize the review meeting. Every project reports green. Utilization sits near 90%. Yet the launch that matters most has slipped twice this quarter, because the three systems architects it needs are also needed by eleven other projects.
Each project report measures what happens inside that project. The queue in front of the architects sits between projects, so no project report shows it. That is the measurement trap: busy people, green projects, and a portfolio that loses money every week a valuable delivery waits.
The gap is not inside your projects. It is between them.
Below are 15 project portfolio management metrics, grouped by the decision each supports, and a worked example that follows one bottleneck from a capacity signal to a contract penalty and a sequencing decision.
What Are Project Portfolio Management Metrics?
Four terms are often used as if they meant the same thing:
- A metric is any defined measure, such as hours logged or open phases.
- A project portfolio management KPI is a metric selected to track a priority portfolio objective.
- A target is the performance you want.
- A threshold is the value that triggers a review or an action.
A number becomes useful when someone owns it and knows what to do when it crosses its threshold.
Scope matters as much as definition. In project portfolio management software, the levels below often share the same data, but they serve different decisions and different owners.
| Scope | What it covers | Decision it supports | Typical owner |
|---|---|---|---|
| Project | One delivery: tasks, scope, cost | Reassign effort inside the project | Project manager |
| Program | Related projects and shared deliverables | Resolve dependencies, adjust rollouts | Program manager |
| Portfolio | Selection, aggregate exposure, shared specialists | Resequence commitments, release or hold work, fund capacity | Head of PMO, portfolio lead |
| PMO service | How well the PMO runs its process | Improve governance and reporting | PMO director |
A project can succeed on its own terms while the portfolio fails, if its progress used people a more valuable project was waiting for. Flow Economics calls this the Project Illusion. Here, portfolio management metrics describe projects and the people who deliver them, not investment-fund returns.
Read more: Strategic Portfolio Management: Process, Benefits & Use Cases
How to Choose Portfolio KPIs
Every candidate KPI should pass six tests:
- Decision relevance: it informs a real trade-off.
- Causal link: moving it plausibly moves an outcome.
- Controllability: it measures only what its owner can influence. Two KPIs that pull against each other are bad KPIs.
- Comparability: same unit and boundary across teams and periods.
- Reliable data: inputs are current without heroic effort.
- Actionability: the response is agreed in advance.
Utilization passes the data test and fails the decision test. It tells you people are busy, not whether the work that carries the money is finishing, and it cannot tell you where extra capacity would pay. Past a certain point, pushing it higher lengthens the queue at the bottleneck, because no slack is left to absorb variation, the mechanism behind the utilization trap. Keep utilization as a capacity diagnostic, not a goal.
A small executive scorecard with drill-downs beats a wall of numbers; how to lay one out is covered in our project portfolio management dashboard guide. One illustrative starting chain: Business Value → capacity gap → bottleneck exposure → schedule predictability → forecast contractual impact → benefits realization: from what is worth protecting, through where it waits, to what the dates cost and what came back.
The 15 metrics fall into six categories, which group into three families by the role they play:
| Family | Category | Metrics |
|---|---|---|
| Value and context | Strategy and value | 1 to 4 |
| Leading flow and resource signals | Portfolio flow; capacity | 5 to 8 |
| Forecasts, outcomes and consequences | Delivery; finance; risk | 9 to 15 |
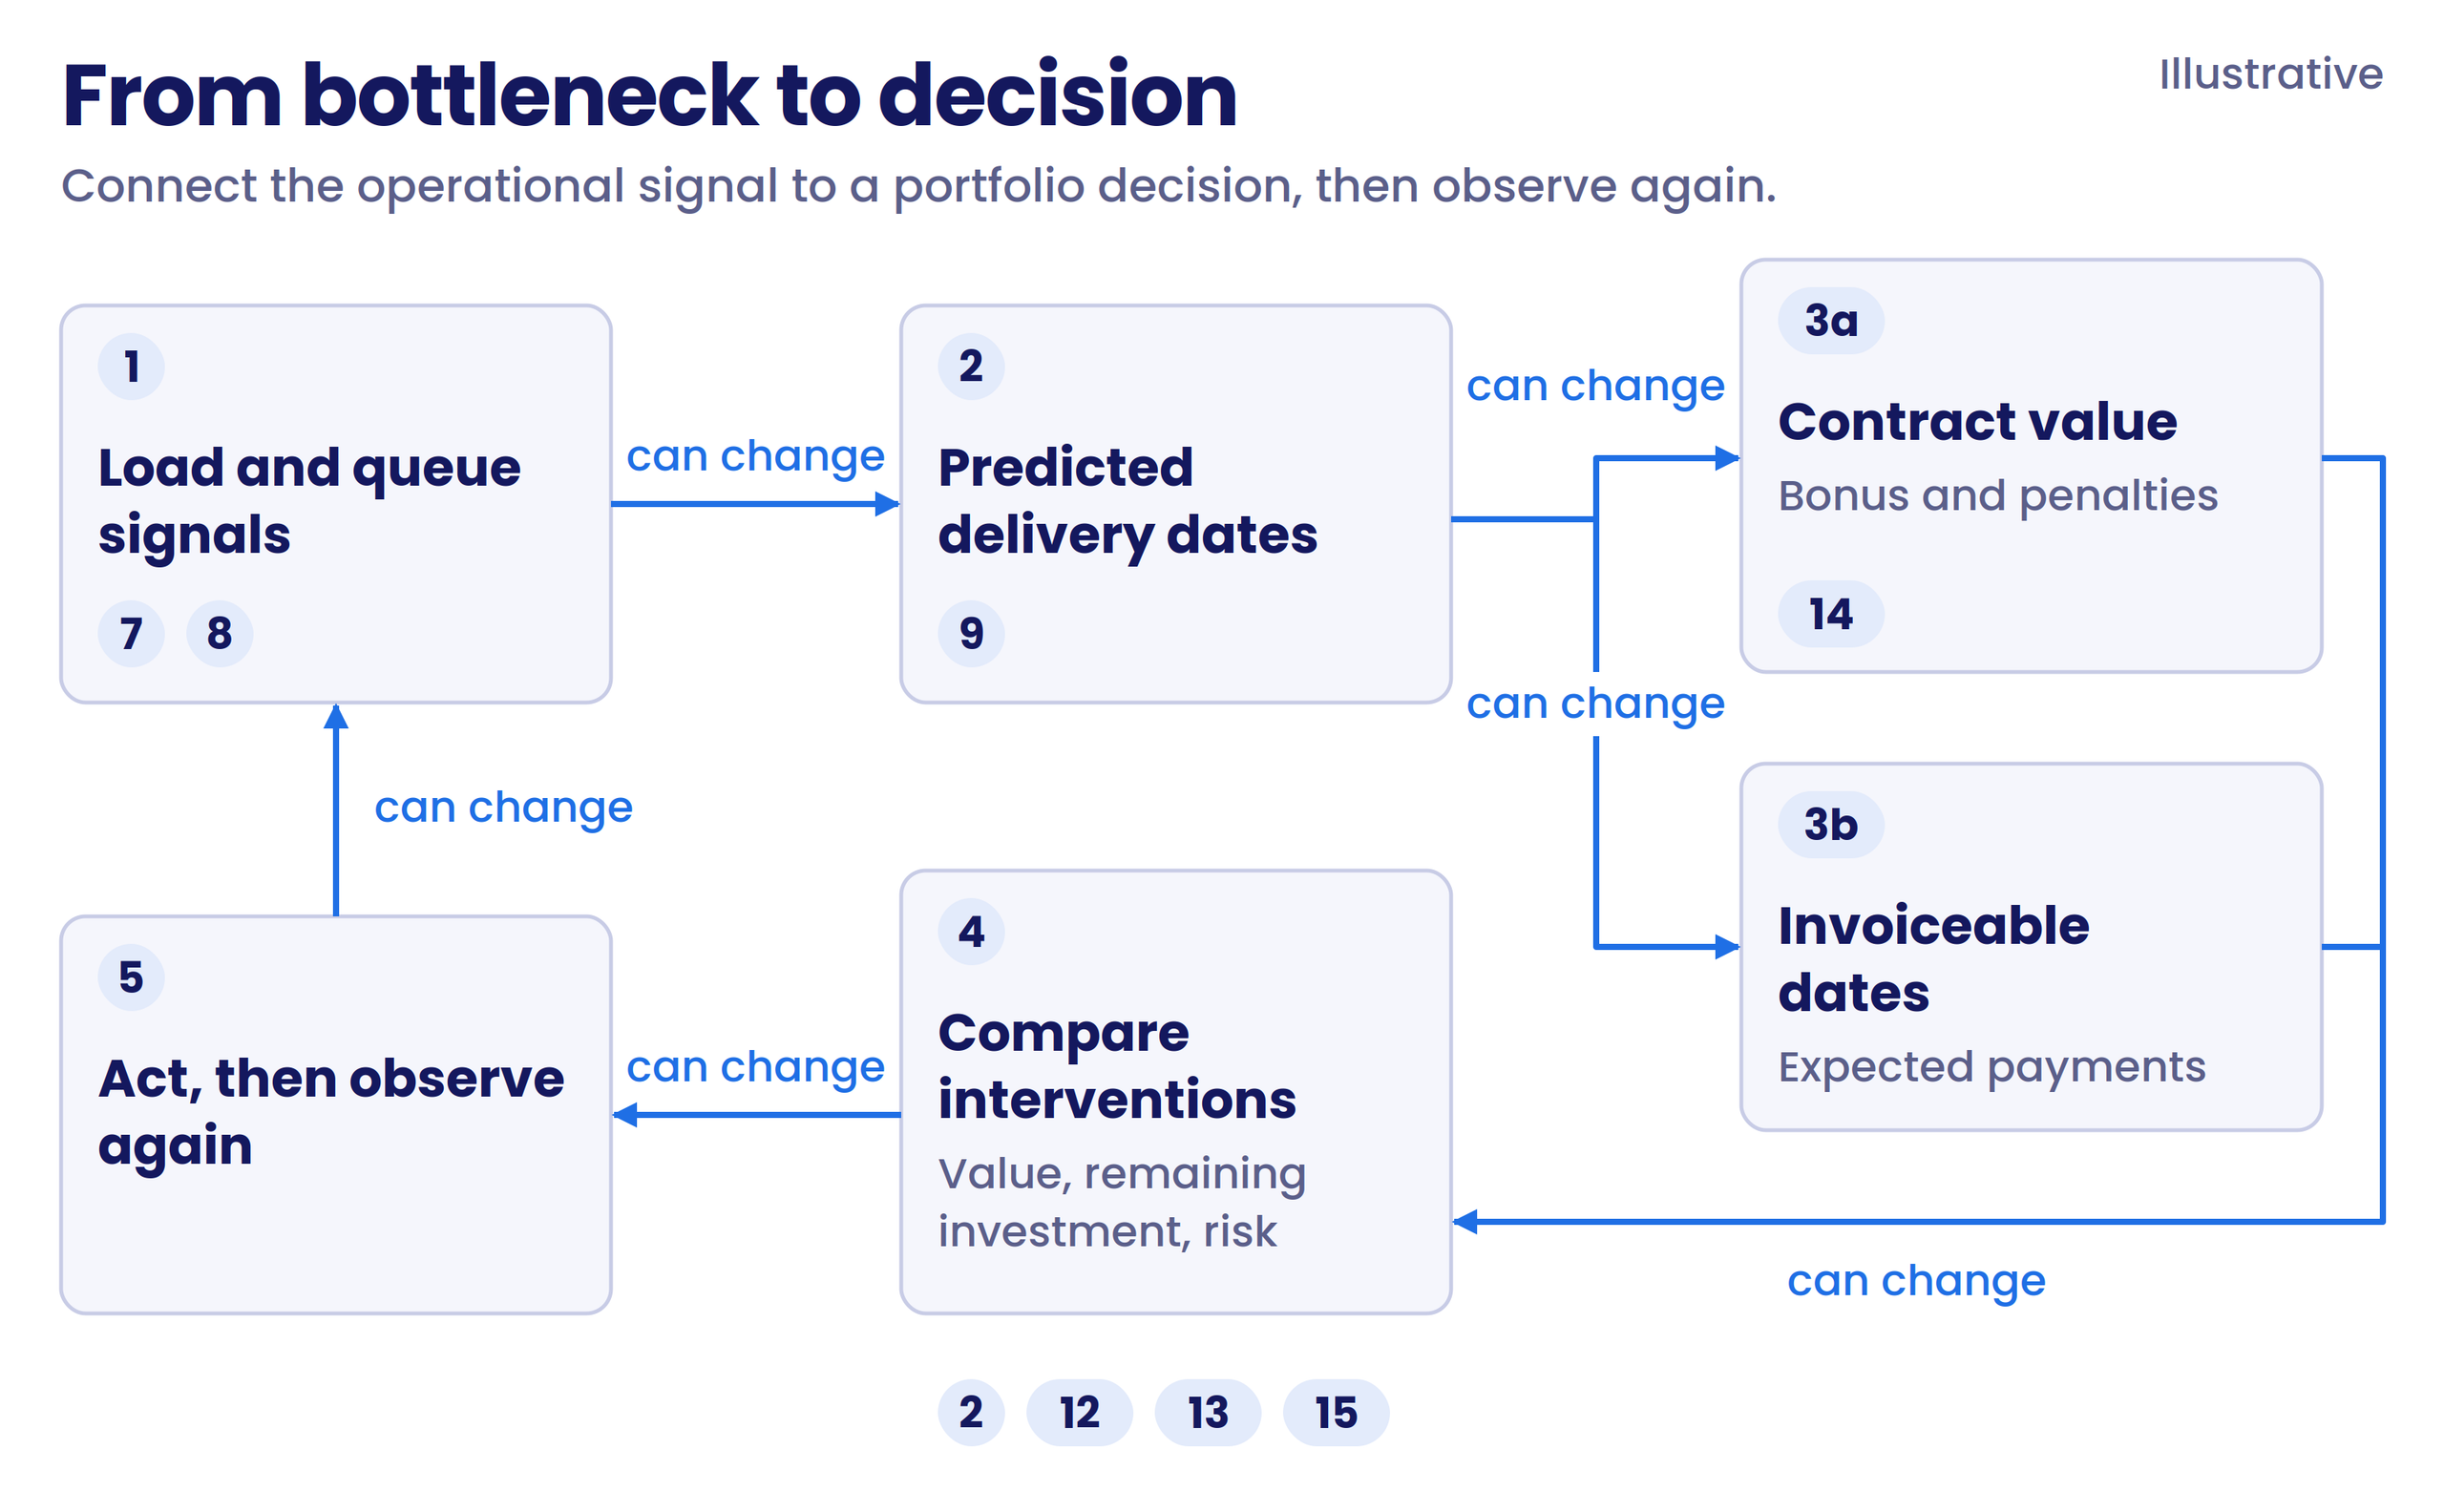
The families are connected: a capacity gap creates a queue, a queue moves a date, a date changes a penalty or a payment month. Add a metric only when it improves a named decision or closes a blind spot you have actually seen.
The 15 Essential Project Portfolio Management Metrics
The table is a quick reference. Thresholds are examples to set locally, not industry standards. Each entry below gives the limits, owners and cadence.
| # | Metric | Calculation and unit | Act when |
|---|---|---|---|
| 1 | Strategic alignment | Linked eligible projects ÷ eligible projects, % | An objective expires or a link lacks sponsor sign-off |
| 2 | Business Value | Weighted score on an agreed rubric, index | A key benefit assumption fails |
| 3 | Benefits realization | Realized ÷ planned benefit due to date, % | Shortfall beyond the agreed tolerance |
| 4 | Portfolio balance | Category funding ÷ total funding, % | A concentration limit is breached |
| 5 | Work in progress | Started, unfinished items, count | WIP over policy while the bottleneck queue grows |
| 6 | Throughput | Accepted items per period, count | Sustained decline against own history |
| 7 | Capacity gap | Required minus available hours, per skill and period | Persistent shortage in the decision window |
| 8 | Bottleneck exposure | Projects needing the bottleneck group ÷ active projects, % | Queue or high-value concentration grows |
| 9 | Schedule predictability | Median forecast error, working days | Error grows or a forecast crosses a commitment |
| 10 | On-time delivery | Milestones met ÷ milestones due, % | A protected commitment is missed |
| 11 | Schedule variance | EV minus PV, money | Variance outside tolerance |
| 12 | Budget variance | Budget minus EAC, money | Forecast overrun beyond tolerance |
| 13 | Remaining budget | Budget minus actual cost, money | ETC exceeds the balance |
| 14 | Forecast contractual and financial impact | Contract value adjusted by predicted bonus or penalty, money | Predicted date crosses a penalty step |
| 15 | Portfolio risk exposure | Probability × impact of monetized risks, money | Exposure breaches risk appetite |
Strategy and value: is this the right set of commitments?
1. Strategic alignment
Calculation: eligible projects with a sponsor-approved link to an active strategic objective, divided by all eligible projects, times 100. Show the count, for example 34 of 40 (85%). List mandatory and enabling projects separately.
Read it with care: a high rate shows intent, not benefit. Tagging can be cosmetic, and a count treats a tool upgrade and a platform launch the same.
Owner and cadence: the strategy lead owns the rule, sponsors own each link, the investment committee decides. At intake and quarterly.
Act by revalidating, reshaping or reconsidering funding. Do not stop mandatory work because it scores low.
2. Business value
Calculation: a documented rubric. Rate each agreed criterion on one scale, multiply by its approved weight (weights sum to one) and add. This is one illustrative method, not a standard. Keep money estimates in a separate field with their assumptions.
Read it with care: a score is an index, not revenue or cash. Scores from different rubrics do not compare. Count an enabling phase's benefit once, not again in the outcome it enables.
Owner and cadence: the sponsor owns the value, the portfolio lead owns rubric consistency, Finance validates money estimates. At intake, gates and scope changes.
Act by reconsidering scope or priority while keeping dependencies and obligations intact.
3. Benefits realization
Calculation: verified cumulative benefit realized by the review date, divided by planned cumulative benefit due by that date, times 100, in the same unit.
Read it with care: finishing a project does not prove adoption. A late rollout shifts the benefit curve, so compare with benefits due now, not the lifetime business case.
Owner and cadence: the benefit owner and sponsor, validated by Finance. On post-delivery cycles, for example 3, 6 and 12 months.
Act by investigating adoption, timing and the original assumption. More in benefits realization management.
4. Portfolio balance
Calculation: approved funding per category divided by total approved funding for the same portfolio and period, compared with agreed ranges. Categories must be mutually exclusive so the shares add to 100%.
Read it with care: there is no ideal mix; name the dimension, such as mandatory versus discretionary or strategic theme. A portfolio can be balanced on money and badly unbalanced on the specialists every project needs.
Owner and cadence: the portfolio lead maintains categories, Finance validates funding, the investment committee owns the mix. Quarterly.
Act by testing intake changes, resequencing or funding shifts.
Portfolio flow: how much is open, and what finishes? Definitions follow The Kanban Guide, applied at portfolio level.
5. Work in progress
Calculation: projects or phases past the agreed start boundary but not the finish boundary, at one item level. Paused and blocked items stay in the count.
Read it with care: by Little's law, more open work at the same output means longer lead times. Still, high WIP alone does not prove overload. Look at item age and where items wait. Shortening one queue can simply move work into the next. Hiding paused items improves the number and nothing else.
Owner and cadence: the PMO flow owner sets boundaries, portfolio operations owns release decisions. Weekly and at every release.
Act by holding new releases and finishing blocked work before starting more.
6. Throughput
Calculation: items that met the agreed finish boundary per period, such as accepted phases per month. It is a count of finished work, not a percentage on time.
Read it with care: two large projects and two small ones are not the same output, so segment by work type. A companion is flow efficiency, active time divided by elapsed time: when it is low, most elapsed time is waiting.
Owner and cadence: the PMO flow owner and delivery leads. Monthly, over a window longer than a typical delivery cycle.
Act by looking for the bottleneck, rework and a shifted work mix before adding people.
Capacity: which group of people limits the plan? This is resource capacity planning at portfolio level.
7. Capacity gap
Calculation: required project hours minus net available project hours, for one skill group and one time bucket. Positive means a shortage: 120 hours required and 80 available is a 40-hour gap (illustrative).
Read it with care: net available means after leave and non-project work. Spare hours in another skill or month do not cover the gap. A gap is a planning problem; on its own it does not say what the shortage costs.
Owner and cadence: the resource manager validates calendars and skills, project leads maintain demand. Weekly.
Act by resequencing, bringing in outside support or testing a capacity scenario, drilled down to skill, period and the projects driving demand.
8. Bottleneck exposure
Calculation: active projects with remaining work that needs the identified bottleneck group within the planning horizon, divided by all active projects, times 100. Show the exposed projects and the queued work beside it.
Read it with care: exposure is not the probability of being late, and a heavily loaded group is not automatically the bottleneck: confirm its availability moves milestones that matter.
Owner and cadence: the resource manager and PMO agree which group is the bottleneck; portfolio operations responds. At every material planning change.
Act by protecting the bottleneck's time, moving work others can do or testing targeted capacity. Then check again: relieving one bottleneck can expose another.
Delivery: how far can the dates be trusted? Project management forecasting supplies the forward half.
9. Schedule predictability
Calculation: median absolute error, in working days, between actual finish and the predicted finish stored at a fixed horizon, for example four weeks before the committed date. Keep the snapshot even if the commitment moves. For active work, predicted finish minus committed target date gives forecast lateness: a risk signal, not proof of accuracy.
Read it with care: the score improves falsely if you measure only near completion or overwrite old forecasts.
Owner and cadence: the planning lead owns the evaluation, portfolio operations acts. Monthly.
Act by checking input quality and the assumptions about shared people, then testing recovery options.
10. On-time delivery
Calculation: eligible milestones due in the period and accepted on or before their locked committed date, divided by all eligible milestones due in the period, times 100. Unfinished overdue milestones stay in the denominator.
Read it with care: record original and formally revised commitments. A good rate can hide one missed milestone that carried most of the value.
Owner and cadence: the delivery lead owns acceptance data, the PMO owns the cohort rule. Monthly.
Act by tracing the cause by project class and bottleneck, and comparing with what the forecast said four weeks earlier.
11. Schedule variance
Calculation: with earned value data, schedule variance (SV) equals earned value minus planned value at one status date. It is measured in budget units, usually money, not days (US Department of Energy EVM tutorial). Report predicted minus baseline finish separately as forecast finish variance.
Read it with care: do not convert SV into a delay or a penalty. Progress on noncritical work can make SV look healthy while the milestone that controls the value slips.
Owner and cadence: project controls owns EVM definitions, delivery leadership responds. Each reporting cycle.
Act by drilling down to the controlling work and the people it waits on, then testing a recovery plan.
Finance: what is spent, what is still needed, and what does timing do to contract value? See the project financials guide for depth.
12. Budget variance
Calculation: variance at completion (VAC) equals approved budget minus estimate at completion (EAC). Bottom-up, EAC equals actual cost plus estimate to complete (ETC). Positive is headroom; negative is a forecast overrun.
Read it with care: budget minus spend to date is remaining budget, not a forecast. Coming in under budget does not prove the investment was a good one.
Owner and cadence: Finance validates, delivery leads supply ETC, the sponsor owns scope and funding. Monthly.
Act by validating the ETC, then choosing between scope, funding and delivery approach. See project financial control.
13. Remaining budget
Calculation: approved monetary budget minus actual costs to date.
Read it with care: this is an authorization balance; ETC is an estimate of future cost. A €100,000 budget with €60,000 spent leaves €40,000. If ETC is €55,000, finishing needs €15,000 more than the balance (illustrative). Keep monetary and work-hour budgets apart.
Owner and cadence: Finance owns the balance, project leads own remaining estimates. At least monthly.
Act by reviewing remaining scope and cost assumptions before the balance runs out.
14. Forecast contractual and financial impact
Calculation: apply the contract's bonus and penalty rule to the predicted completion date versus the contractual baseline, and adjust base contract value by the result. Define grace periods, rates, steps and caps. Many penalties are stepped: one extra day can cost nothing, or the whole step.
Read it with care: this metric puts a price on each week of delay where the contract sets one. For a continue-or-stop decision, compare the value still to come with the cost still required. Moving an invoiceable milestone into an earlier month changes timing, not profit.
Owner and cadence: Finance or the contract owner validates terms, planners refresh dates. After each re-forecast.
Act by comparing alternatives, including their effect on other projects.
Risk: which uncertainties could break the plan?
15. Portfolio risk exposure
Calculation: for consistently monetized threats, expected loss equals probability times impact, summed without counting one consequence twice. Report pre-response and residual exposure separately; where money is the wrong unit, keep a labeled qualitative view.
Read it with care: red, amber and green scores added together are not money. A shared supplier or specialist group can hit several projects at once, so test combined cases with scenarios. Do not count a forecast penalty again as a risk.
Owner and cadence: the risk owner maintains assumptions, Finance validates money impacts. Monthly. See project risk management.
Act by mitigating, resequencing or holding contingency.
Read more: Project Profitability Analysis: How Delivery Dates Change the Financial Picture
Leading vs Lagging Portfolio Indicators
Leading and lagging are relative to an outcome and a horizon. Throughput records past output, yet it also feeds the next plan. A forecast leads only as far as it has proven accurate, which is why metric 9 exists. The most useful pair is load and lateness: resource overload shows up weeks before projects turn red, so steer on the load, not the milestone report. And a field labeled "actual" in a tool may describe the current plan, not an economic event such as cash received.
| Metrics | What they tell you now | Validate with |
|---|---|---|
| 1 to 4, strategy and value | Intent and mix, not results | Benefits realized, scope and dependency review |
| 5, 6, flow | Open work and observed output | Item age, queues, later delivery |
| 7, 8, capacity | Early signs the plan cannot hold | Resource-constrained dates, not the assumption that every overload delays |
| 9 to 11, delivery | Forecast quality and delivery results | Stored forecasts, controlling work, contract rules |
| 12 to 14, finance | Cost adequacy and the price of timing | Actual spend, ETC, contract events |
| 15, risk | Forward uncertainty under stated assumptions | Actual loss events, contingency use |
Treat this as a diagnostic route, not a formula.
Worked example: two projects, one specialist team
This is an illustrative model, not a customer result or software output. Two projects are ready at week 0. Each needs six uninterrupted weeks from the same specialist team, which can work on only one at a time. All contract value is still to be earned, remaining cost is what it takes to finish, and nothing else is in the portfolio.
| Input | Project A | Project B |
|---|---|---|
| Contract value before penalties | €1,200,000 | €900,000 |
| Remaining investment | €400,000 | €450,000 |
| Team duration | 6 weeks | 6 weeks |
| Penalty | €20,000 per week after week 6 | €250,000 once if finished after week 8 |
| RRI (contract value ÷ remaining investment) | 3.00× | 2.00× |
The last row is RRI, return on remaining investment: expected remaining value divided by the estimated cost to complete, shown as a multiple. It asks the right question, whether finishing is still worth what is left to spend, but one project at a time. Ranked that way, A goes first.
| Sequence | A finishes | B finishes | Total penalty | Forward net contribution |
|---|---|---|---|---|
| A then B | Week 6 | Week 12 | €250,000 | €1,000,000 |
| B then A | Week 12 | Week 6 | €120,000 | €1,130,000 |
| B then accelerated A | Week 10 | Week 6 | €80,000 | €1,140,000 |
Combined contract value is €2,100,000 and remaining investment is €850,000.
- A then B: B lands in week 12, past its week 8 limit, so the €250,000 penalty applies. €2,100,000 - €850,000 - €250,000 = €1,000,000.
- B then A: A lands in week 12, six weeks late at €20,000 a week. €2,100,000 - €850,000 - €120,000 = €1,130,000.
- B then accelerated A: €30,000 spent on acceleration (extra capacity) cuts A from six weeks to four, assuming it displaces no other work. A lands in week 10, four weeks late. €2,100,000 - €850,000 - €80,000 - €30,000 = €1,140,000.
Doing B first adds €130,000, even though A has the higher RRI, and costs nothing. Acceleration then avoids €40,000 of penalty for €30,000, another €10,000; saving only one week would not cover its cost. The order matters: resequence before you spend, and buy extra capacity only where the money it returns exceeds its cost.
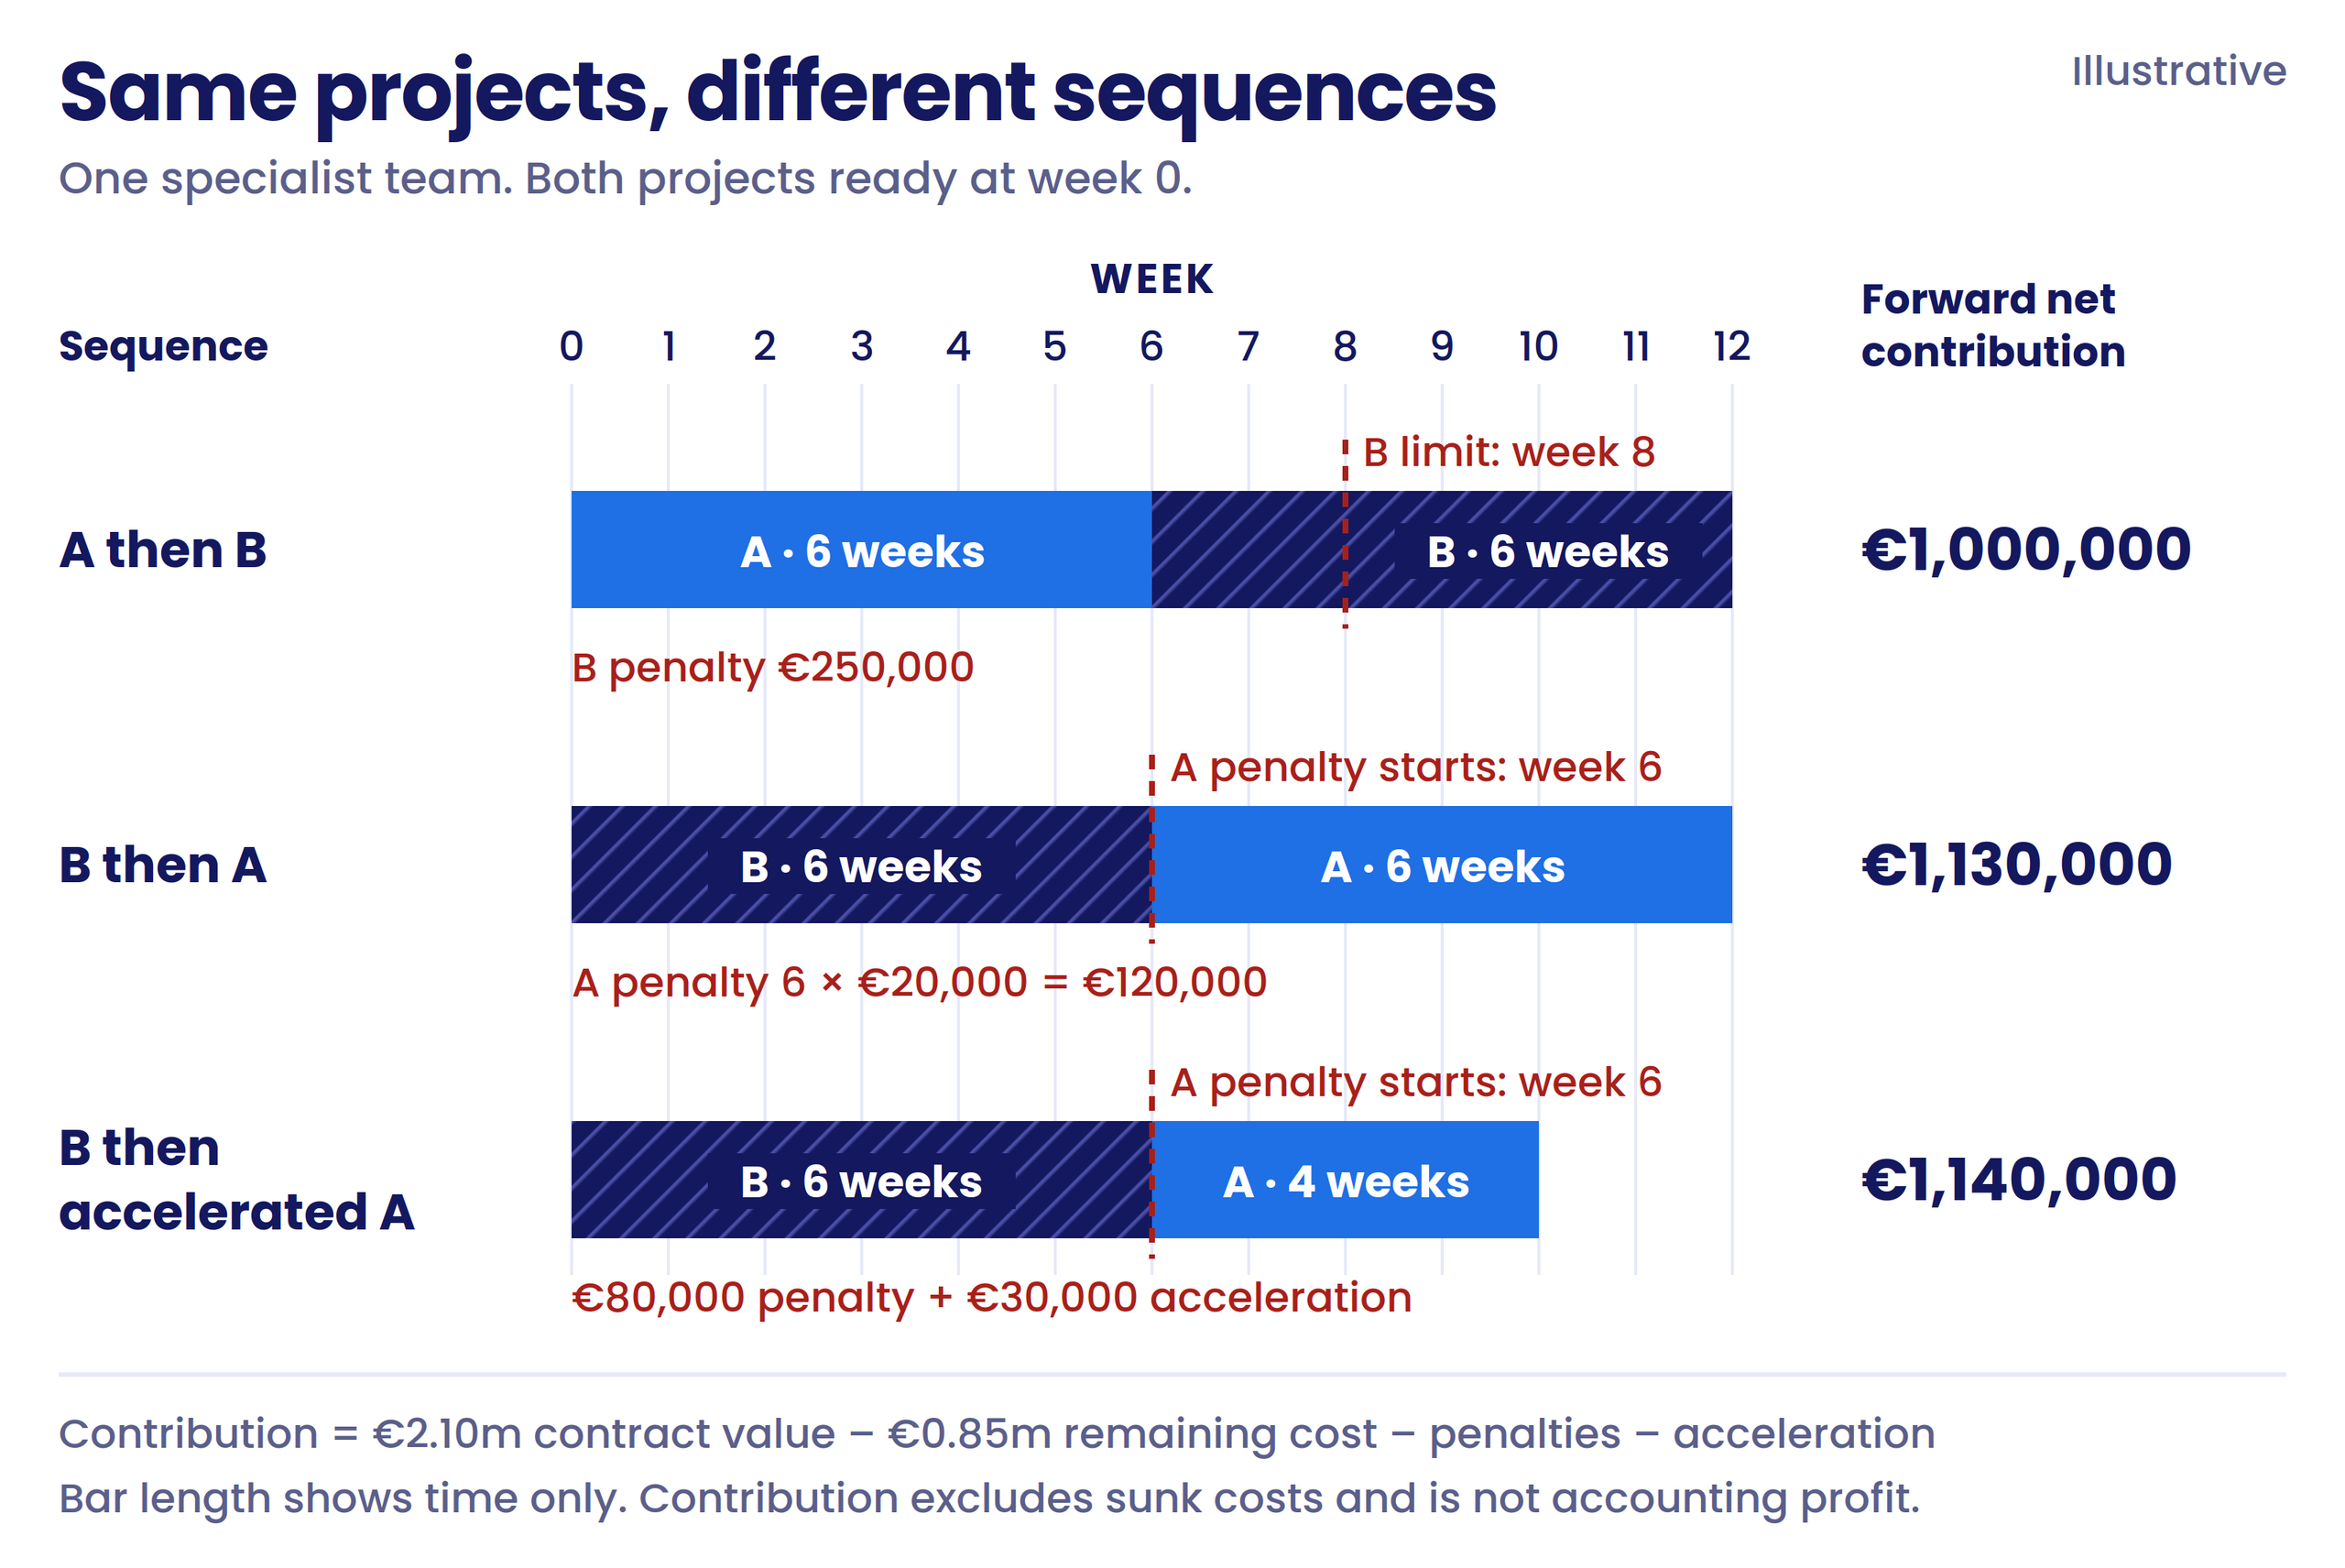
Read the chain back through the metrics. Capacity gap and bottleneck exposure (7, 8) show both projects need the same team in the same weeks. The sequence sets the dates (9), the dates cross different penalty rules (14), and remaining investment (12, 13) sets what is still to be spent. A static ranking by RRI would have missed a €130,000 difference, which is why a mixed portfolio is never ranked on RRI alone.
Forward net contribution means contract value after modeled penalties, minus remaining costs. It excludes sunk cost, tax, discounting, collection risk and other projects, so it is not accounting profit.
Build a Portfolio Metric Dictionary
A metric dictionary records how each indicator is calculated, sourced, owned and acted on, so two people reading the same number reach the same conclusion. It separates four roles:
- Definition owner: maintains the formula and threshold logic.
- Data owner: keeps the inputs accurate and current.
- Decision owner: acts when a threshold is crossed.
- System owner: manages fields, access and configuration in the tool.
Use one record per metric:
| Field group | Fields |
|---|---|
| Identity | Name, ID, decision supported, category, leading or lagging role |
| Calculation | Formula, numerator and denominator, unit, date basis, horizon, cohort, exclusions, missing values |
| Evidence | Source system and fields, timestamp, assumptions, known limits, drill-downs |
| Accountability | Definition, data, decision and system owners; cadence; trigger; threshold; actions |
| Control | Standard, configured, derived or connected; version and change history; gaming risk |
A filled example for one financial metric:
| Field | Entry |
|---|---|
| Metric and decision | Predicted contractual penalty (FIN-14a). Decide whether to change the sequence or fund targeted acceleration. |
| Calculation and unit | Penalty from the approved bonus and penalty rule at the predicted completion date versus the contractual baseline. Shown as a nonnegative euro amount; signed adjustments converted consistently. |
| Scope and exclusions | Active projects with validated penalty terms, one planning scenario and timestamp at a time. Internal projects without contract terms are excluded. |
| Data and drill-down | Latest prediction, approved rule, contract value, baseline date; drill down to milestone and bottleneck group. |
| Owners | Definition: Finance or contract owner. Data: planner. Decision: portfolio lead. System: administrator. |
| Cadence | After each re-forecast or contract change, and weekly. Show the prediction timestamp. |
| Threshold (illustrative) | The predicted date crosses the next penalty step before the next irreversible commitment. A monetary materiality floor is optional. |
| Action | Compare feasible sequence and capacity options; check the gain after intervention cost and effects on other projects; name an owner and a follow-up date. |
| Controls | Not a settled claim or liability. Show bonuses and penalties gross. Version the baseline and rule; watch for moved dates or dropped projects. |
The review loop is short: define the decision before the metric, validate inputs, drill down to the cause, compare interventions across every affected project, record the owner and follow-up date, then check the result. Keep a metric only while it supports a decision.
Common PPM Metric Mistakes
Most measurement failures come from how the system is designed, not from the people reporting into it.
| Mistake | Correction |
|---|---|
| Too many metrics | Removal test: drop any metric that informed no decision in the last two review cycles |
| Vanity or duplicate indicators, such as hours saved by automation on work nothing was waiting for | Decision audit: map every KPI to a named intervention |
| Lag-only reporting | Pair each lagging outcome with a leading companion, such as on-time delivery with predicted finish |
| Averages that hide the problem | Drill down by skill, project cohort and bottleneck group |
| Rebaselined dates | Lock baselines and keep versioned forecast snapshots |
| Targets without action | Name one decision owner for each threshold |
Three financial errors deserve their own warning:
- Calling remaining budget ETC. Remaining budget is unspent authorization. ETC is the cost still needed. A positive balance proves nothing if ETC is larger.
- Calling expected payments collected cash. Invoiceable dates and expected payment timing are forecasts derived from the schedule, not bank balances.
- Counting the same delay twice. A contractual penalty is one part of what a delay costs, next to shifted revenue and later cash. Add the parts once; never add the penalty again on top of a total that already includes it.
Read more: How to Implement Project Portfolio Management (PPM): Steps, Challenges, and Costs Explained
How Epicflow supports a configurable portfolio scorecard
Epicflow does not ship a fixed 15-KPI dashboard. It gives the portfolio a resource-constrained prediction, a plan built around the people you actually have, and puts money on the dates that prediction produces. A review runs like the worked example:
- Find the bottleneck. Future Load shows demand against capacity per skill group, and Prediction recalculates every project's finish date across the whole portfolio. See capacity planning.
- Price the delay. Bonus & Penalty Schemes, linear or stepped, with grace periods and caps, turn predicted dates into predicted revenue and profit per project. Predicted profit subtracts costs already incurred, not the cost still to come, so read it as the timing effect, not final margin. Each project also shows RRI, Epicflow's implementation of Stephen Devaux's DIPP, as a multiple with ROI alongside, so you can see whether finishing is still worth the remaining spend. RRI informs portfolio decisions; it is never a personal target. See manage projects as investments.
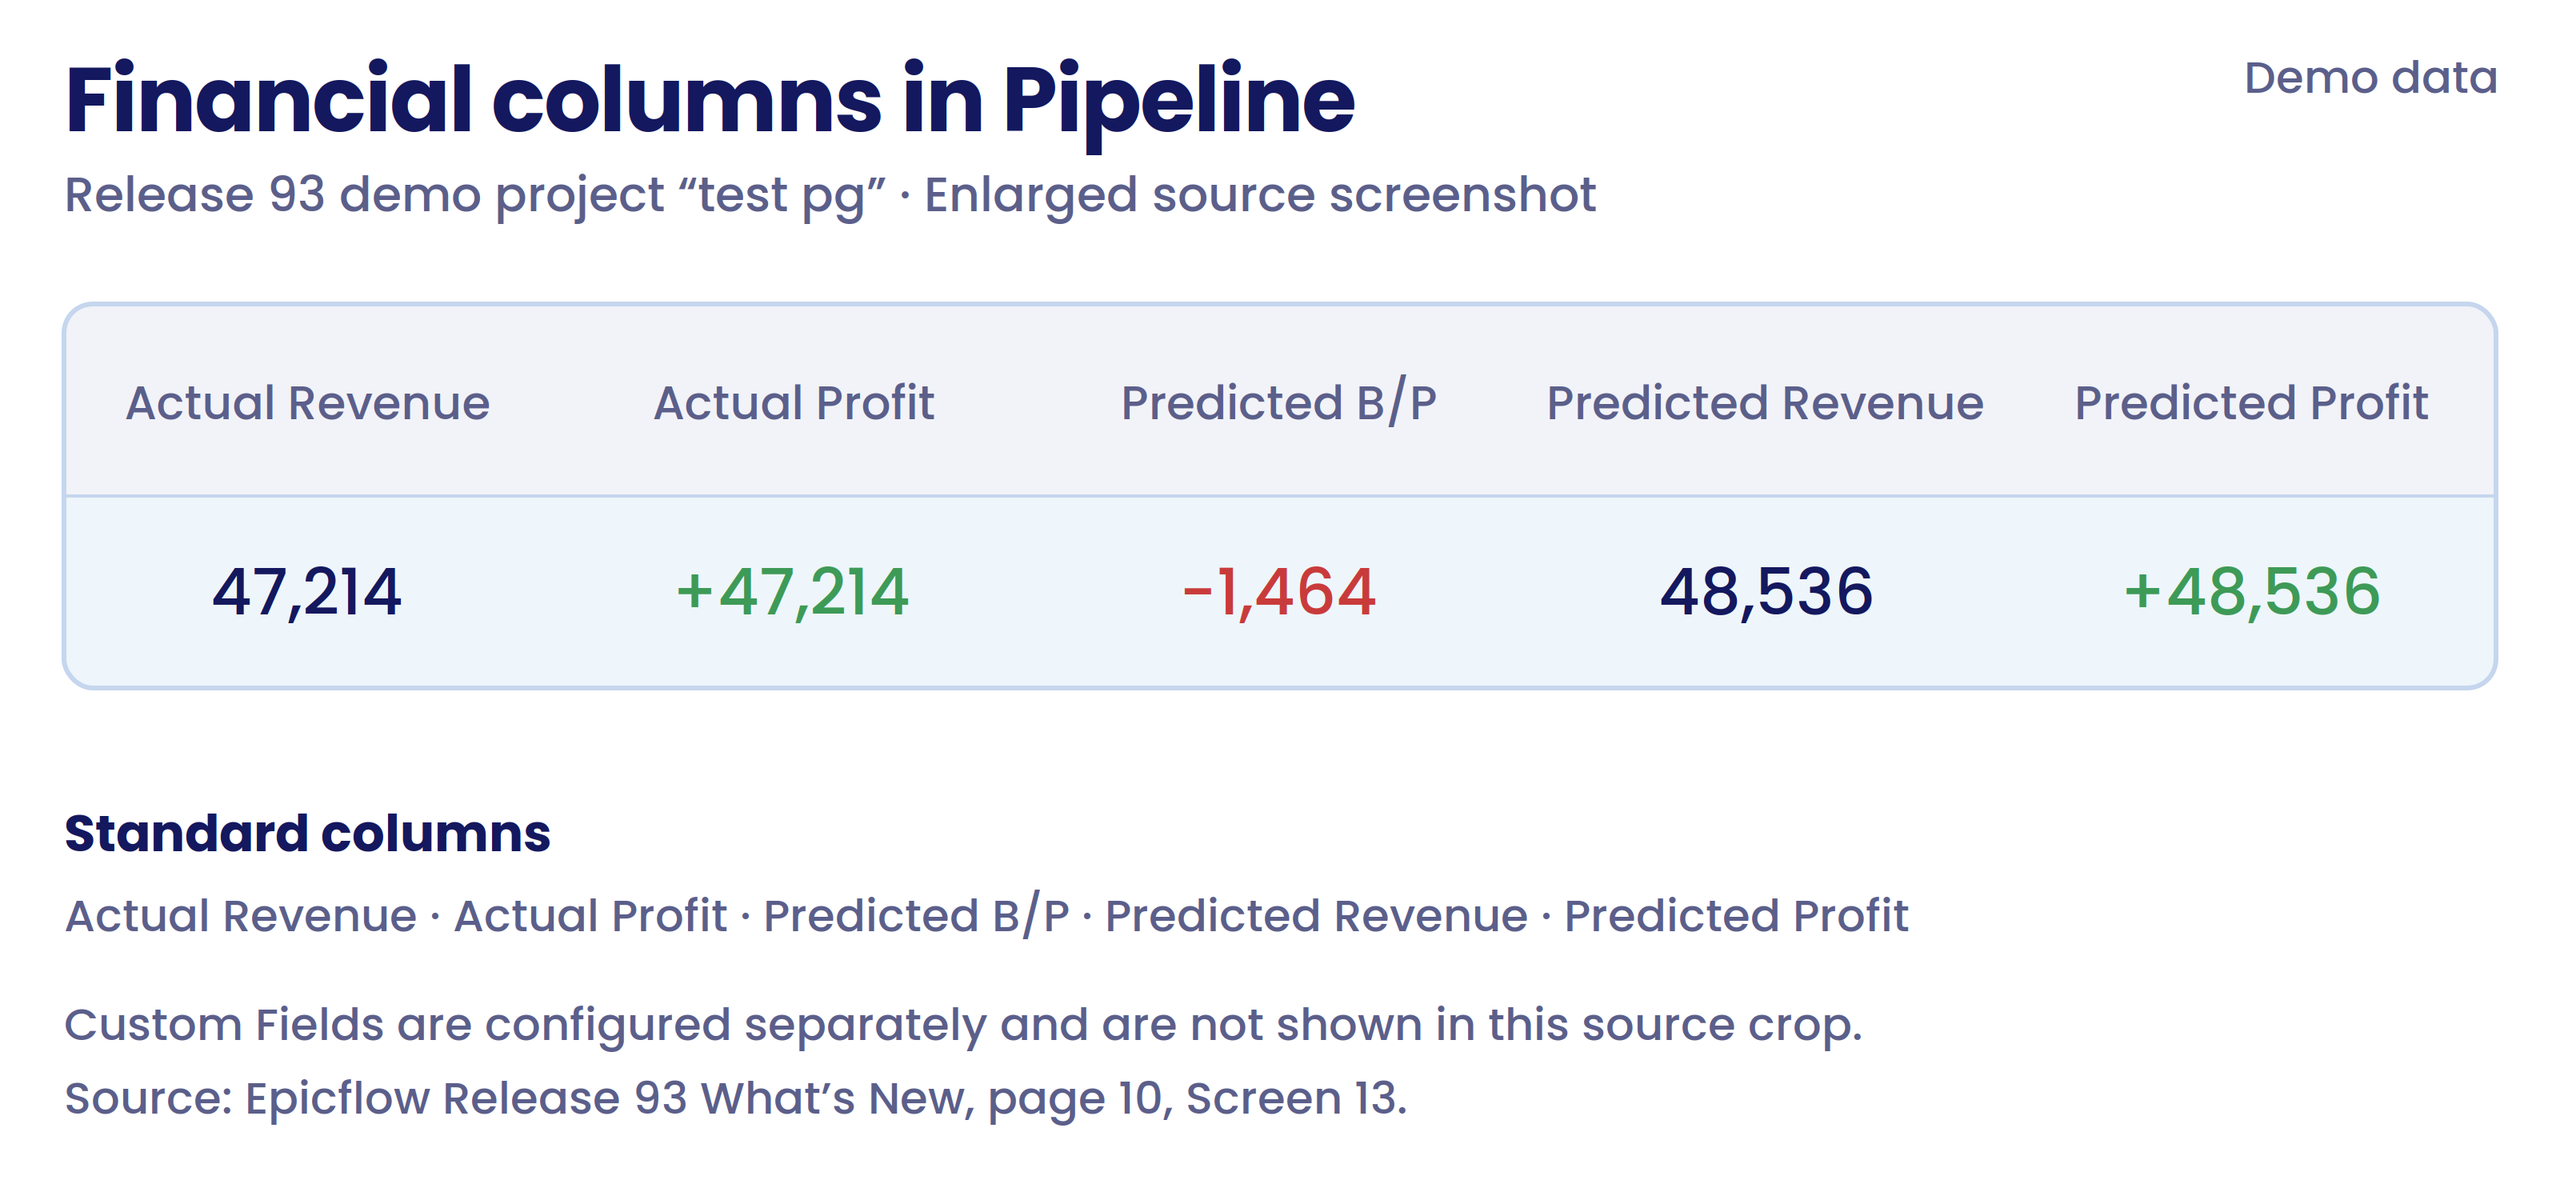
- Add context. In the Pipeline view, each user chooses standard columns, Attributes and Custom Fields, so Business Value (a priority weight, not a euro amount), strategic tier or an organization-defined score sits beside dates and money. A Custom Field displays a value; the governance still comes from your dictionary.
- Compare options before committing. What-if analysis tests a different sequence or added capacity, including the effect on cash timing, before anything changes in live projects.
- Follow the cash. Cash Flow combines invoiceable milestone dates with payment terms to show when payments are expected. It is a forecast derived from the schedule, not a bank balance.
For larger portfolios, the Epicflow Portfolio Optimizer (EPO) searches resource-constrained alternatives and recommends a sequence; your people make the decision. At KPN, working this way took due-date performance from 18% to 80%.
Bring your project list and one real decision, such as which project goes first or where extra capacity pays for itself. We run it on your own data and show how the dates and the money change. Schedule a Live Demo
Frequently Asked Questions
What are project portfolio management metrics?
Project portfolio management metrics measure whether a portfolio picks valuable work, fits it to available capacity, delivers predictably and realizes its intended outcomes. They cover six areas: strategy and value, flow, capacity, delivery, finance and risk. Unlike project metrics, they look across projects, at the shared people where many delays start.
What are the most important project portfolio management KPIs?
No single ranking fits every portfolio. A balanced set covers value, flow, capacity, delivery, finance and risk. A practical starting point is Business Value, capacity gap, bottleneck exposure, schedule predictability, forecast contractual impact and benefits realization.
How many portfolio metrics should a PMO track?
As few as your decisions need. A short executive scorecard with drill-downs works better than all 15 on one screen; the 15 here are a reference menu, not a requirement. Add a metric only when it changes a decision or closes a blind spot you have actually seen.
What is the difference between a leading and lagging project KPI?
A leading KPI signals a likely outcome while you can still change it. A lagging KPI records what happened. A growing capacity gap or a predicted penalty is leading; on-time delivery and realized benefits are lagging. The label depends on the horizon.
How often should portfolio KPIs be reviewed?
Match the cadence to the decision and the data refresh. Flow and capacity signals suit a weekly review and every release decision. Budget metrics follow the monthly financial close. Forecast contractual impact belongs after each re-forecast. Benefits realization runs on post-delivery cycles, often at 3, 6 and 12 months.
Who owns project portfolio metrics?
Ownership has four parts. The definition owner, usually the PMO, maintains formulas and thresholds. Data owners, such as resource managers and project leads, keep inputs current. Decision owners, sponsors and portfolio leaders, act on threshold breaches. A system owner manages the tool, and Finance validates money and benefit assumptions.