What Is Business Value In Project Management, and How Should a PMO Use It?
 Victoria Sokolova
.
Published
.
Project Portfolio Management
.
28 mins READ
Victoria Sokolova
.
Published
.
Project Portfolio Management
.
28 mins READ
Business value in project management is the expected contribution a project, or one phase of it, makes to the organization's financial, customer, operational, strategic, risk or compliance outcomes. Treat it as a testable hypothesis with an owner, a measure, a confidence level and a review date, not as a permanent score. For a PMO, business value matters when it decides which work gets scarce specialist time first.
This is different from the value of project management itself. That phrase asks why the discipline pays off. This article is about the value assigned to the work, and what a portfolio office does with it.
Here’s a scenario that may sound familiar from your portfolio intake meetings. Each business case arrives with a value score: 85, 70, 92. The portfolio board approves the list. Three months later, eleven projects are booked on the same verification team, and the order they get it in is set by whoever escalates loudest. The scores are still in the intake spreadsheet. Nobody has opened it since.
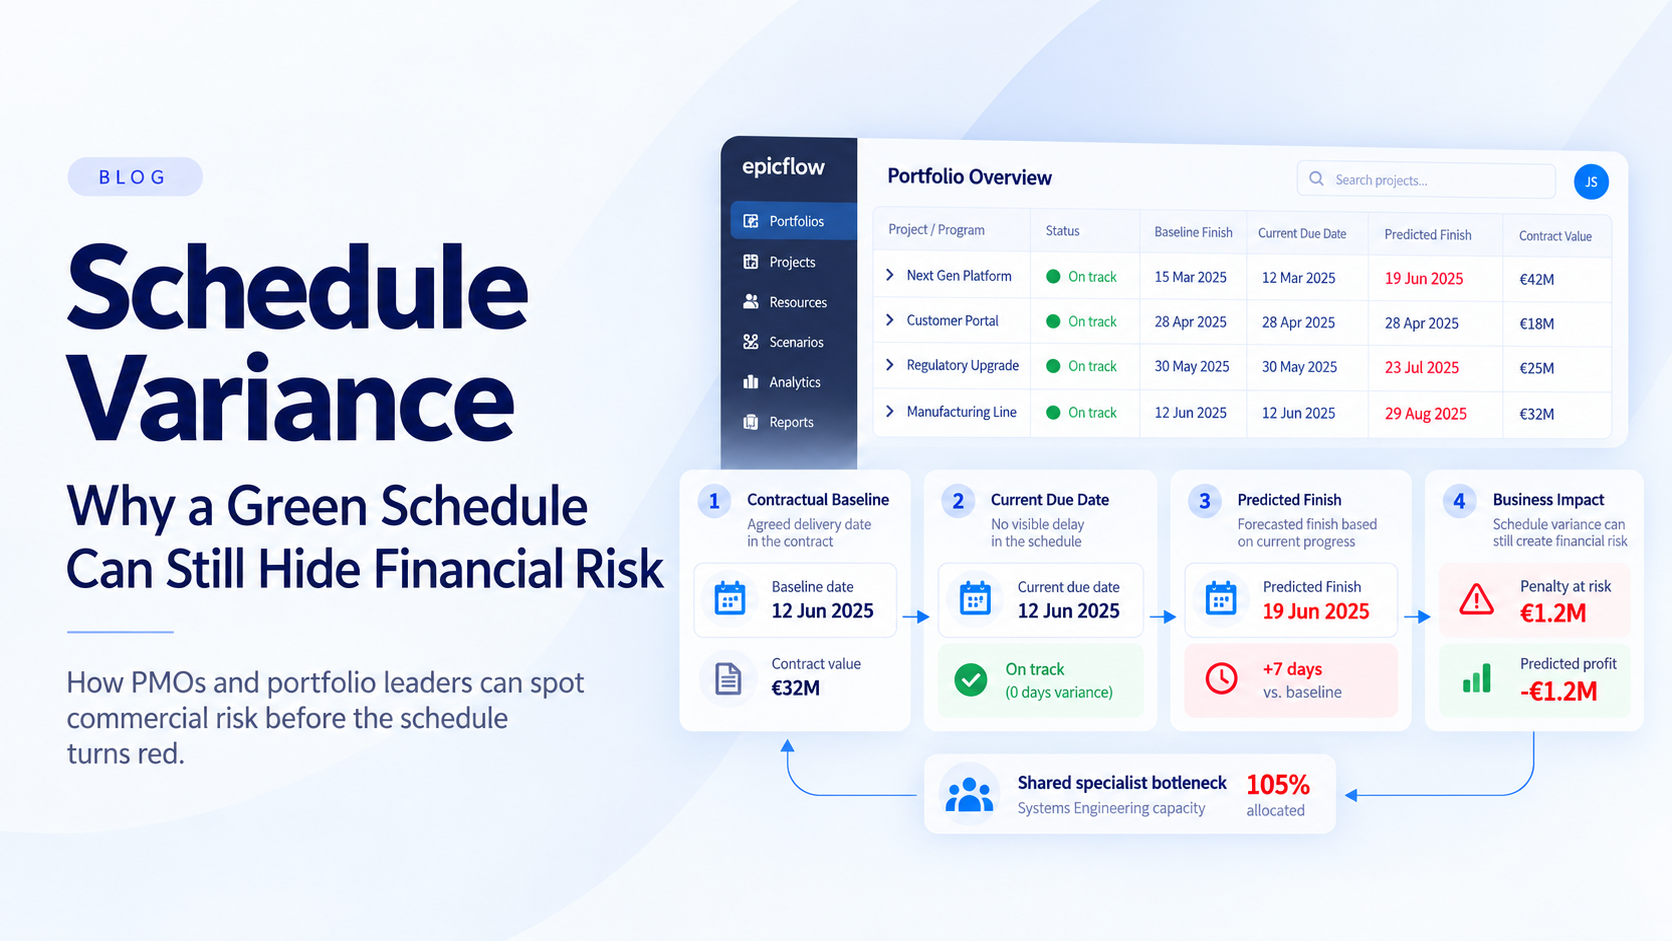
The scores were not wrong. They were never connected to the one decision that sets delivery dates.
A business value score earns its place only when it changes who gets the bottleneck team next.
What Is Business Value In Project Management?
Business value is the net benefit an organization expects from completing a piece of work, measured against the outcomes it cares about. It exists in three versions: expected before delivery, forecast during delivery and realized after it. Those are three different numbers, and they should never share a column.
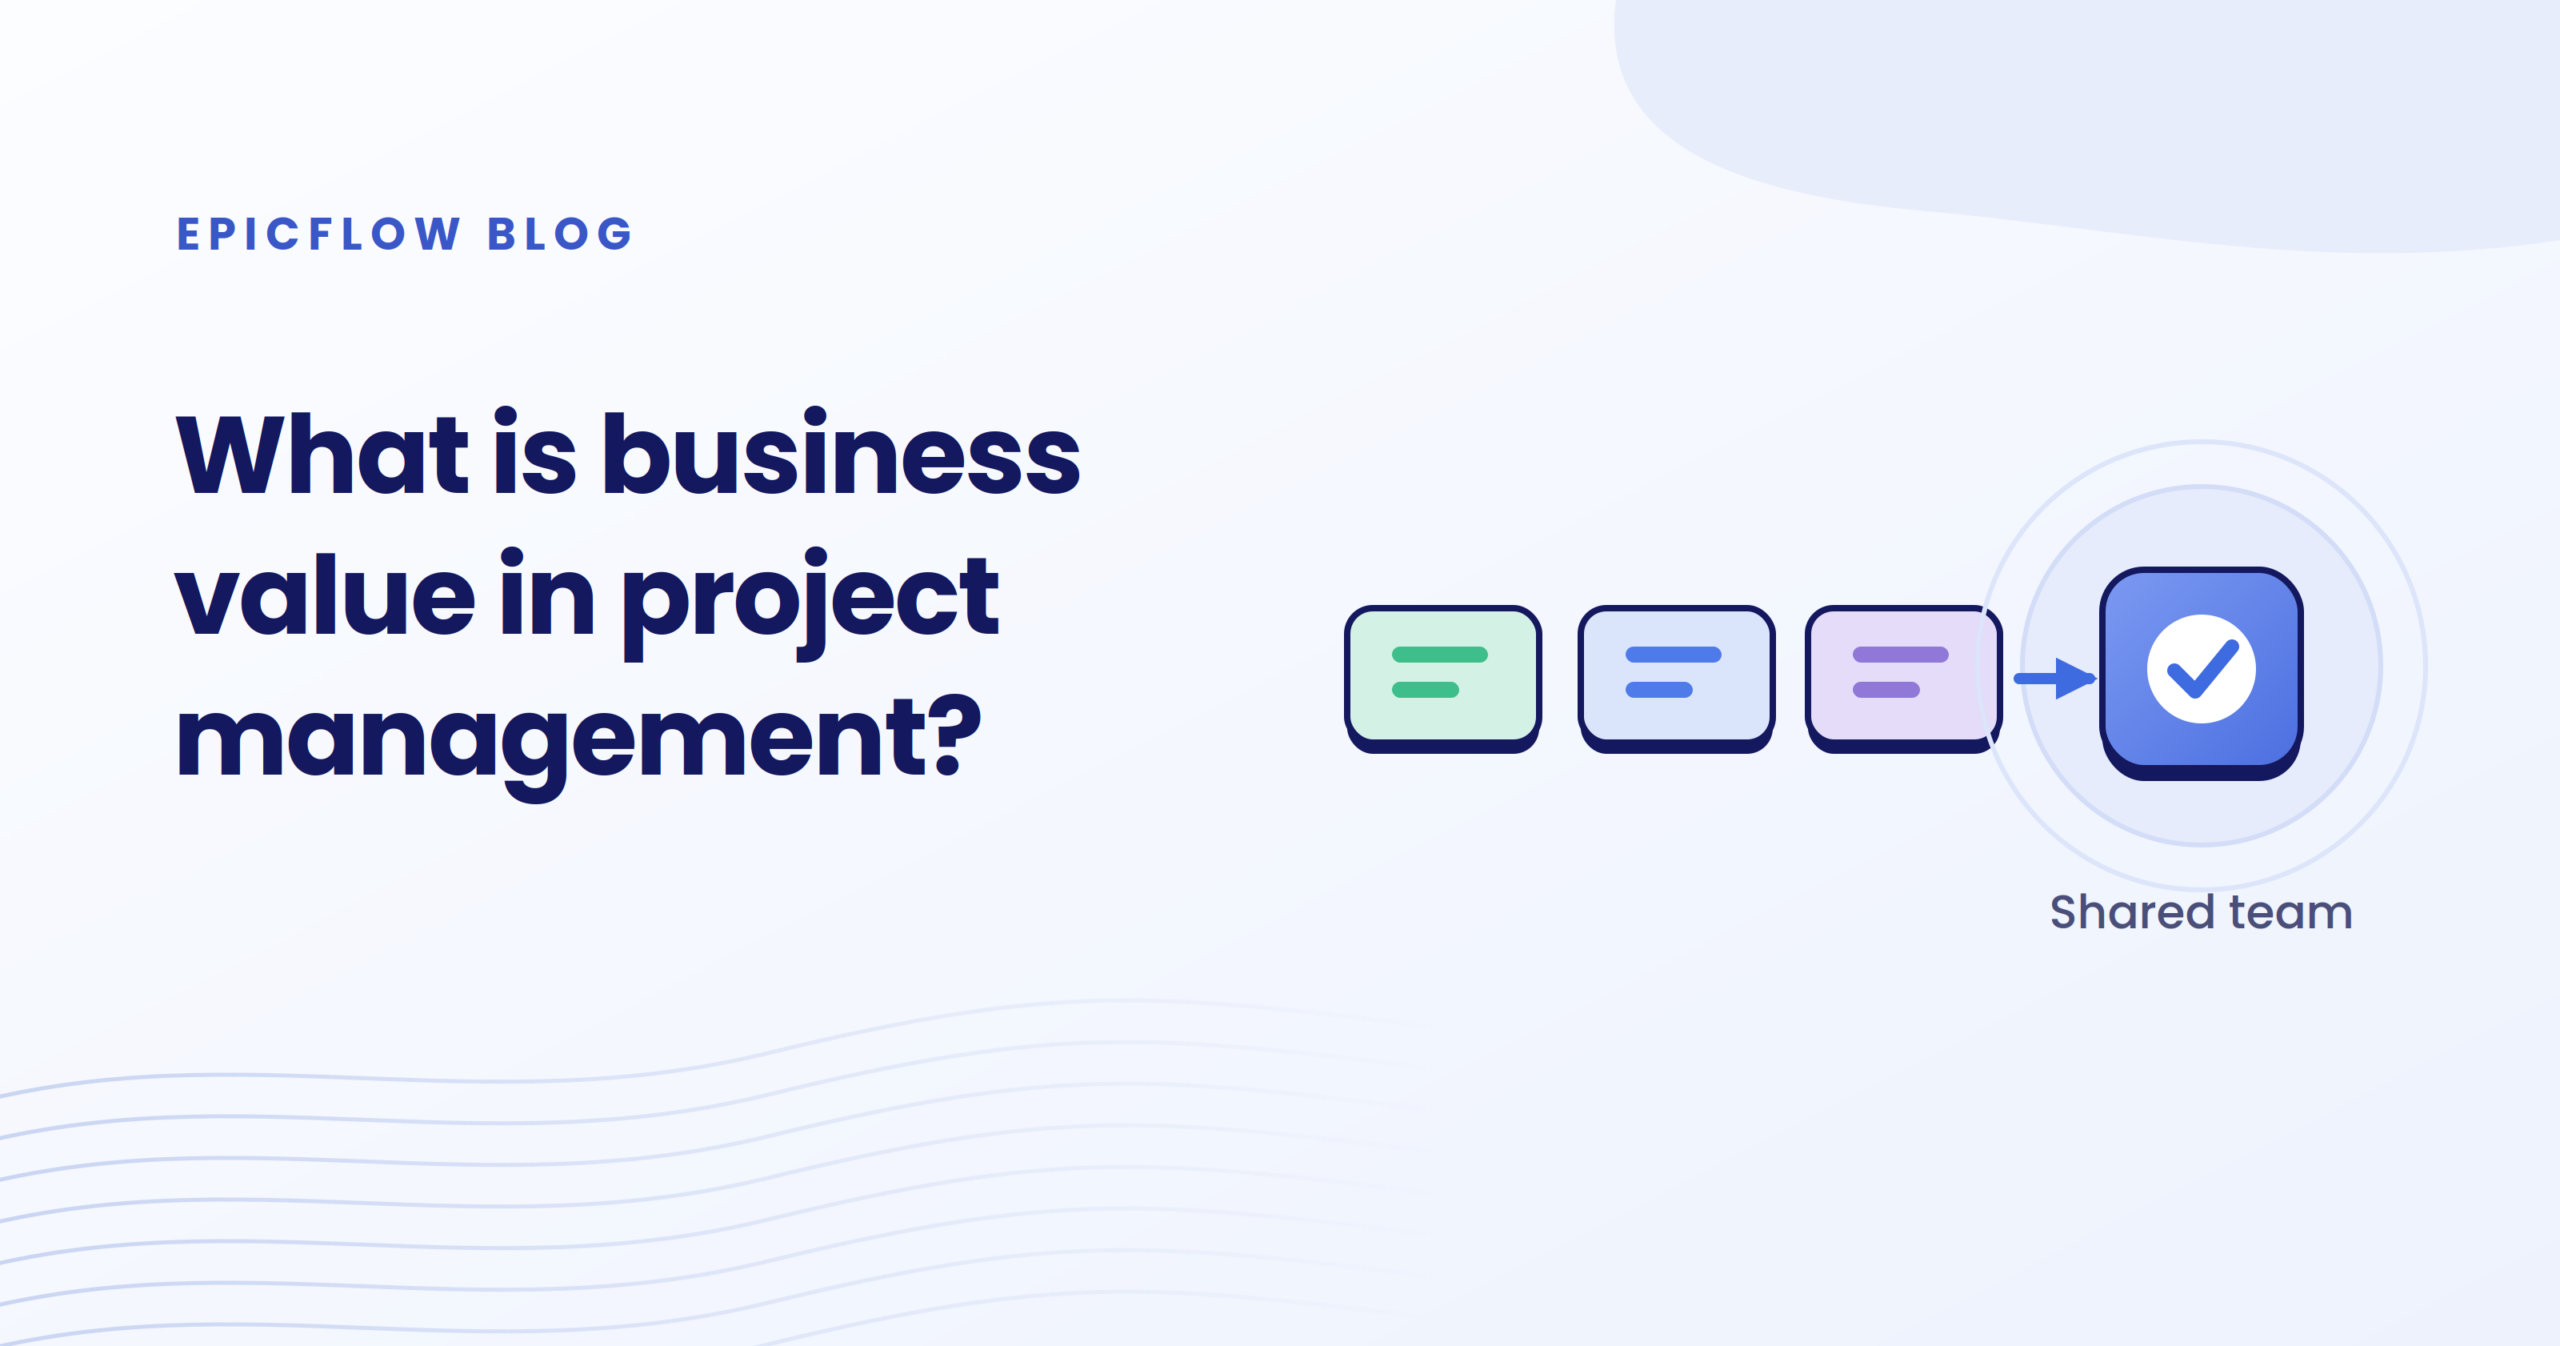
PMI's current standard describes projects as part of a "system for value delivery" (PMI, 2021). The system part is where most portfolios stop short. Value passes through three layers, and each one needs the one before it:
- A value statement says why the work matters: "strategic for the platform".
- A value measure, or success measure, says how you would know: "warranty returns down from 4% to 2% within 12 months of launch".
- A value decision says what the measure changes: funding, sequence, or who gets scarce people first.
Most portfolios have the first layer. Some have the second. Few connect the third.
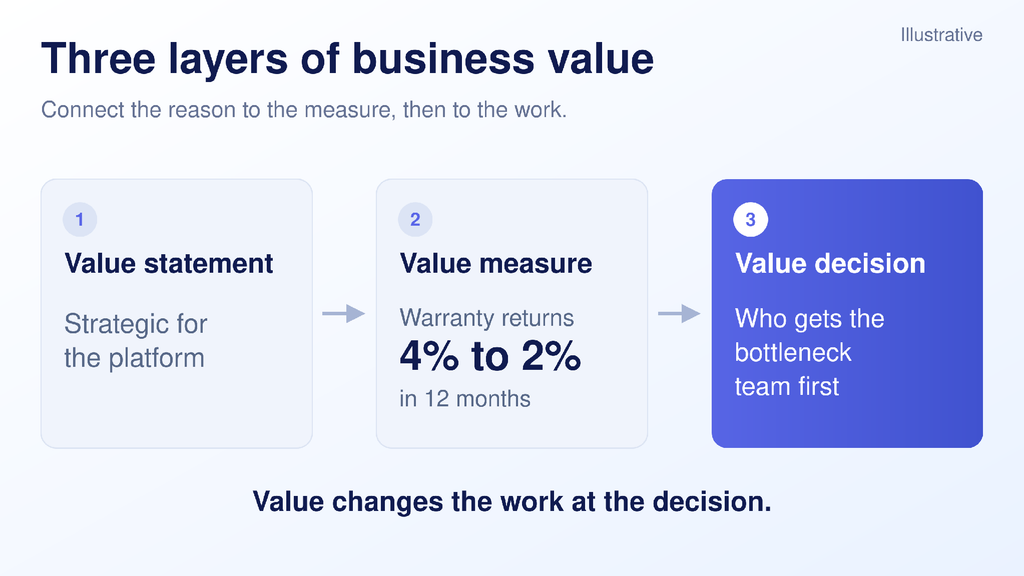
Figure 1. Value changes the work only at the third layer: the decision. Illustrative.
The terms around it are often used as synonyms:
| Term | What it means | Example | How it relates to business value |
|---|---|---|---|
| Output | What the project produces | A qualified test rig | Can be delivered and never used |
| Outcome | A change in performance | Test cycle cut from 10 days to 6 | The evidence of value |
| Benefit | A measurable gain with an owner | $400,000 a year less rework | One part of business value |
| ROI | Return on investment: net return divided by investment | 2.5x over five years | One financial ratio; ignores timing and capacity |
| Strategic alignment | Link to an approved objective | Supports the electrification roadmap | Intent, not evidence |
| Urgency | How fast value is lost with delay | A contract penalty starts in May | A property of value over time |
| Priority | The order in which work gets people | Phase 2 before phase 3 | The decision value should inform |
Value also differs inside a project. One phase triggers a customer payment. Another removes a dependency three other projects wait on. A third adds polish nobody pays for yet. A single project-level score averages these away. Value starts to steer the work when you score the phase that competes for the bottleneck team.
Why is project management valuable to businesses, then? Because it makes these decisions repeatable. The value of project management in organizations shows up less in reports than in the quality of the sequence it produces.
What Types of Business Value Can a Project Create?
Six types cover most engineering portfolios. Each needs its own measure, and each can be counted twice if nobody is watching.
Strategic value
Strategic value moves the organization toward a stated objective: a new market, a platform, a capability. Measure it with the objective's own indicator, not with a tag. A project that "supports the roadmap" without a measure has a statement, not value.
Customer value
Customer value changes what customers receive: kept dates, quality, features they pay for. Measure it as retention, renewals or on-time delivery against a baseline.
Operational value
Operational value lowers the cost or time of running the business: shorter test cycles, less rework, fewer handoffs. Enabling work belongs here. A test-rig qualification that three programs wait on has operational value far beyond its own scope. So does learning value: a prototype that removes uncertainty before a large commitment.
Financial value
Financial value is revenue, margin, cost avoided and payment timing. It is the easiest type to count and the easiest to overweight. Use ROI or net present value where the cash flows are known, and keep the assumptions next to the number.
Risk and resilience value
Risk value reduces the chance or impact of a loss: a single-supplier exposure, an aging test platform, one engineer nobody can replace. Express it as expected loss avoided, with the probability stated.
Compliance and mandatory value
Mandatory work is required by law, regulation, safety or contract. It does not compete on score. It enters the portfolio as a commitment, and the only question is when, not whether.
The same gain often appears twice. A faster test cycle shows up as operational value, then again as financial value when someone converts the saved hours into money. Count it once, in the type its owner will be measured on.
How Do You Define a Project Value Hypothesis?
A value hypothesis states what a project or phase will change, for whom, by how much, by when, and how you will know. Writing it down turns a score into something you can check and revise.
Illustrative example, from an automotive validation program:
| Field | What to write | Example |
|---|---|---|
| Outcome | The change, not the deliverable | Shorter validation cycle per vehicle variant |
| Beneficiary | Who gains | Three vehicle programs waiting on the test rig |
| Metric and baseline | Measure and current value | 10 working days per validation cycle |
| Target and timeframe | Value and date | 6 working days, from Q3 |
| Benefit owner | One named person | Head of Validation |
| Assumptions | What must be true | Rig qualified by end of Q2; staffing unchanged |
| Confidence | High, medium or low, with a reason | Medium: the rig supplier has slipped before |
| Dependencies | What it waits on, what waits on it | Waits on the verification team; three programs wait on it |
| Downside | What happens if it is late | Each program slips one week per week of delay |
| Evidence source | Where realized value will be read | Test log in the PLM system |
The benefit owner is a business role, not the project manager. The project manager owns delivery of the output. The PMO owns the method and the review cadence. The benefit owner answers for the value.
Most templates skip confidence, dependencies and downside. Those are the three fields that matter most when two hypotheses compete for the same people.
How Should a PMO Score and Compare Business Value?
Most PMOs use a weighted scoring model: rate each project on a few criteria, multiply by agreed weights, add the results into a weighted score. It works as a first filter. It fails as a sequencing rule.
An illustrative model:
| Criterion | Weight | What a 5 means |
|---|---|---|
| Financial value | 0.35 | More than $2M net over three years |
| Customer value | 0.25 | Protects a named key-account commitment |
| Strategic value | 0.20 | A measurable step on an approved objective |
| Risk reduction | 0.20 | Removes one of the portfolio's top ten risks |
Three rules sit outside the score. Mandatory work bypasses the ranking. Every scale point is anchored with an example, so a 4 means the same in every department. Confidence is shown next to the score, never multiplied in silently.
Even a well-built model misses three things.
Confidence. A 90 at low confidence and a 70 at high confidence are not ordered by their numbers. Show both. Where you have a basis for the probability, use risk-adjusted value: expected value multiplied by the chance of achieving it.
Time. Value is lost at different speeds. A product launch that misses part of its market window loses more than an internal tool delayed a month. Urgency is the price of a week of waiting.
Capacity. This is where most models break. Two projects with the same score can place very different resource demand on the bottleneck team: the specialists every project needs at the same time. Every week that team spends on one phase is a week every other phase waits. That is the opportunity cost the score cannot see.
The practical rule is simple. Divide the price of a week of waiting by the effort the work needs from the bottleneck team, in weeks, then start with the highest result. In product development, Donald Reinertsen describes the same logic as weighted shortest job first: cost of delay divided by duration (Reinertsen, 2009). In plain words, the question becomes: what is an hour of your most loaded team worth on this work, compared with the next-best use of that hour? Flow Economics calls this value per constrained resource hour, and explores it in VMO and competing priorities.
Check portfolio balance separately: ten high scores in one product line can leave nothing for the next.
How Does Business Value Change Across the Project Lifecycle?
Value is not fixed at intake. It moves when markets, contracts and dates move. A PMO should read a different number at each stage, and a stage gate is where a value hypothesis gets tested.
| Stage | Value question | Number to read | Owner |
|---|---|---|---|
| Intake and selection | Is it worth doing at all? | Expected value, with confidence | Sponsor, portfolio board |
| Planning | Which phases carry the value? | Expected value per phase | Benefit owner, PMO |
| Stage gate | Is it still worth finishing? | Forecast value against remaining cost | Portfolio board |
| Delivery | What does a week of delay cost now? | Price of waiting at the predicted date | PMO, delivery lead |
| Benefits realization review | Did it deliver? | Realized value against baseline | Benefit owner |
| Lessons | Were our estimates any good? | Expected against realized, by type | PMO |
At a stage gate, money already spent is gone. The right question is whether the value still to come justifies the money still to spend. A project 80% complete whose market has shrunk can be worth less than the cost of finishing it. A project half done, with a large payment behind its last phase, can be worth more than it was at intake.
Keep expected, forecast and realized value in separate fields. When they share a column, nobody can learn which estimates were wrong.
Which Phase Should Get the Bottleneck Team First?
Illustrative example. An engineering organization has one verification team. Three phases from three projects are ready for it in the same week. The team works on one phase at a time.
| Phase | Business Value score | Price of a week of waiting | Team-weeks needed | Waiting cost per team-week |
|---|---|---|---|---|
| A. Platform integration, new product line | 90 | $30,000: a week of launch revenue | 6 | $5,000 |
| B. Acceptance testing, defense contract | 60 | $40,000 per week late, after week 4: contract penalty | 2 | $20,000 |
| C. Test-rig qualification, three programs waiting | 40 | $30,000: $10,000 for each waiting program | 1 | $30,000 |
Assumptions: the cost accrues for every week a phase waits before the team starts on it. Phase B pays nothing if it finishes by the end of week 4. The work content is the same in every order.
Order by score: A, then B, then C.
- A starts now. Waiting cost: $0.
- B starts in week 7 and finishes at the end of week 8, four weeks late: 4 × $40,000 = $160,000.
- C waits eight weeks: 8 × $30,000 = $240,000.
- Total: $400,000.
Order by waiting cost per team-week: C, then B, then A.
- C starts now. Waiting cost: $0.
- B starts in week 2 and finishes at the end of week 3, inside its date: $0.
- A waits three weeks: 3 × $30,000 = $90,000.
- Total: $90,000.
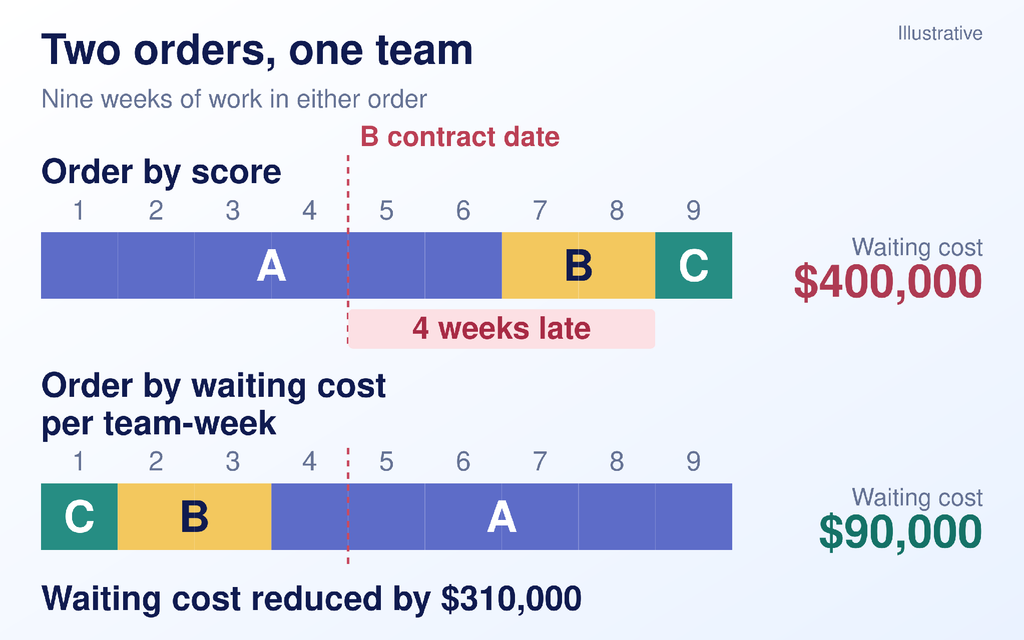
Figure 2. Same team, same nine weeks of work, two orders. Illustrative.
Same team, same nine weeks of work, a $310,000 difference in one quarter. The highest-scoring phase still goes. It goes three weeks later.
For phase A to deserve the team first, a week of its delay would have to cost more than $180,000: six times the estimate. That is the conversation to have with its sponsor. Not "your score is wrong", but "is a week of your launch worth $180,000?"
Confidence matters too. B rests on a contract term and C on three dated milestones; A is a market estimate. The order holds even if A's estimate doubles: three weeks at $60,000 is $180,000, against $400,000.
The PMO takes the sequence to the portfolio board with the arithmetic and assumptions on one page. The board decides. The score was one input, not the decision.
Where Do Business Value Scores Go Wrong?
| Mistake | What it causes | Fix |
|---|---|---|
| Score set once at intake | The ranking drifts from reality | Revisit at each stage gate and whenever a date moves |
| No benefit owner | Nobody reports realization | Name one owner per hypothesis |
| No baseline | Realized value cannot be measured | Record the metric before work starts |
| Benefits counted twice | Portfolio value looks larger than it is | Count each gain once, in one type |
| Revenue-only weighting | Enabling and risk work starve | Weight operational and risk value explicitly |
| Mandatory work scored | Compliance work loses to features | Take it out of the ranking; schedule it as a commitment |
| Hidden uncertainty | A guess outranks a contract | Show confidence next to every score |
| Capacity-blind ranking | The bottleneck team works where an hour is worth least | Compare value per week of bottleneck time |
The last mistake costs the most, because it repeats every week the queue exists.
How Does Epicflow Turn Business Value Into an Allocation Decision?
Epicflow, a portfolio platform that plans multi-project work around finite specialist capacity, does not invent business value. People set it. Epicflow puts it next to the capacity and the money, so the score meets the decision it should inform:
- Find the bottleneck. Epicflow builds a resource-constrained prediction of the whole portfolio: a plan built around the people you actually have. The Future Load Graph shows which team every project is queuing for, weeks before the queue reaches a status report. See resource capacity planning.
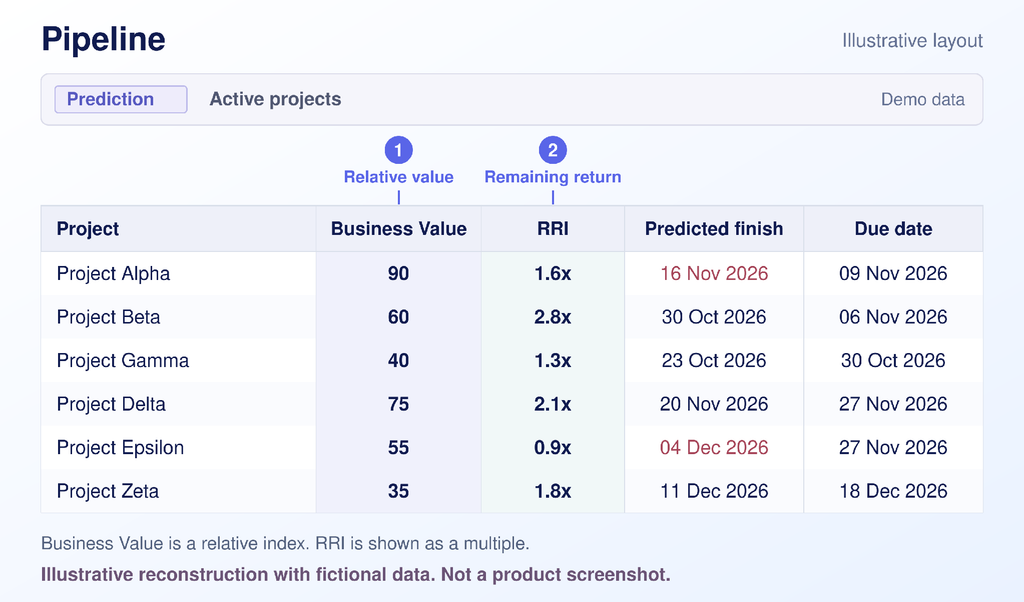
- Put value where the work competes. Business Value is a relative index you set on a project, a phase or a task; a summary's value passes down to items without their own. In the Pipeline, you choose the columns that sit beside dates and money: Business Value, Attributes such as client or product line, and Custom Fields for your own value measures.
- Decide how far value steers the sequence. When Epicflow runs a prediction, one setting balances the order you have set against Business Value. Move it toward value when the commercial ranking should win. It is a management choice, made on purpose.
- Price the waiting. Revenue and bonus and penalty schemes turn each predicted date into predicted revenue and profit per project. Epicflow also shows whether each project is still worth finishing: what the remaining work releases, divided by what is left to spend. If you want the technical name, that figure is RRI, Return on Remaining Investment, shown as a multiple and built on Stephen Devaux's work (Devaux, 2014). See manage projects as investments.
- Test the move before you make it. What-If Analysis runs the alternative order, C before B before A in the example, and shows the change in dates, penalties and cash timing before anything changes in live projects. For larger portfolios, the Epicflow Portfolio Optimizer searches resource-constrained sequences and recommends one. Your people decide.
At KPN, working this way took due-date performance from 18% to 80%.
What Changes When the PMO Manages Value, Not Only the Schedule?
A PMO that reports whether approved projects are on plan answers one question: are we doing what we said? A Value Management Office (VMO) answers a harder one: is the work we are doing now still the best use of the people we have? The PMO manages the schedule. The VMO manages economic value. Flow Economics sets out what a value management office does in more depth.
The shift starts with one change in the weekly portfolio review: every sequencing decision is argued in value per week of the bottleneck team, with the assumptions on the table.
Bring your project list and one real decision, such as which phase gets your busiest team first. We run it on your own data and show how the dates and the money change. Schedule a Live Demo
Read more: Value-Based Portfolio Management | How to Prioritize Projects | 10 PMO KPIs
Frequently Asked Questions
What is business value in project management?
Business value in project management is the expected net benefit a project or phase creates for the organization, across financial, customer, operational, strategic, risk and compliance outcomes. Write it as a hypothesis with an owner, a measure, a baseline, a confidence level and a review date. It is expected before delivery, forecast during it and realized after it.
What is an example of business value in a project?
Qualifying a shared test rig that three vehicle programs wait on. The outcome: validation cycles cut from 10 working days to 6 from Q3, owned by the Head of Validation. The value is not the rig. It is the weeks three programs stop waiting, worth $30,000 per week of delay in the illustrative example above.
How do you measure the business value of a project?
Record a baseline before work starts, set a target and a date, and name the person who will report the result. After delivery, compare the realized outcome with the baseline, not with the plan. Separate what the project caused from what would have happened anyway, and read the result against the cost and specialist time it used.
What is the difference between business value and ROI?
ROI is one financial ratio: net return divided by investment. Business value is broader. It includes customer, operational, risk and compliance outcomes a ratio leaves out, and it changes with timing: the same project is worth less if it lands after its market window. Use project ROI as one input to business value, not as a substitute.
Who owns business value in a project?
A named business owner, usually the sponsor or the head of the function that receives the benefit. The project manager owns delivery of the output. The PMO owns the method: the template, the scoring rules, the review cadence and the comparison across projects. When value has no named owner, nobody reports whether it was realized.
How should a PMO prioritize projects by value?
Take mandatory work out of the ranking first. For the rest, compare the price of a week of waiting with the weeks of bottleneck time each project needs, and start with the highest price per bottleneck week. Show confidence next to every figure. Revisit the order whenever a date, a contract or the bottleneck team's load changes.
References
Devaux, S. A. (2014). Managing projects as investments: Earned value to business value. CRC Press.
Project Management Institute. (2021). The standard for project management and a guide to the project management body of knowledge (PMBOK guide) (7th ed.). Project Management Institute.
Reinertsen, D. G. (2009). The principles of product development flow: Second generation lean product development. Celeritas Publishing.